 |
|---|
| Plate V-8 |
|
|---|
| Plate V-8 |
These next four pages are dedicated to a more comprehensive review of perhaps the best-documented volcanic eruption in history and of the role that satellite remote sensing has played in this study. On May 18, 1980, in southwest Washington State, on the western slopes of the Cascade Mountains some 75 km northeast of Portland, Oregon, in less than 1 minute, Mount St. Helens (MSH)--the youngest of the active andesitic volcanoes in the Cascade chain-blew its top in a dramatic and awesome sequence of events that took 60 lives, destroyed more than 200 homes, and exacted damage to the Pacific Northwest that exceeded $1 billion. In addition to camera-wielding ground witnesses (several of whom perished), observers in light aircraft recorded on film the instant of eruption and most of the subsequent activity during the entire eruption phase. Scientists had been monitoring changing conditions at MSH for several months before the fateful day and had carried out numerous measurements during a continuing watch for several previous years. Because the day itself was crystal clear over much of the western United States, a NOAA Weather Satellite successfully tracked the initial and subsequent ash clouds as they progressed hundreds of kilometers to the east. Later that summer, both Landsat and the Heat Capacity Mapping Mission (HCMM) satellites obtained striking visible and thermal images of the scene.
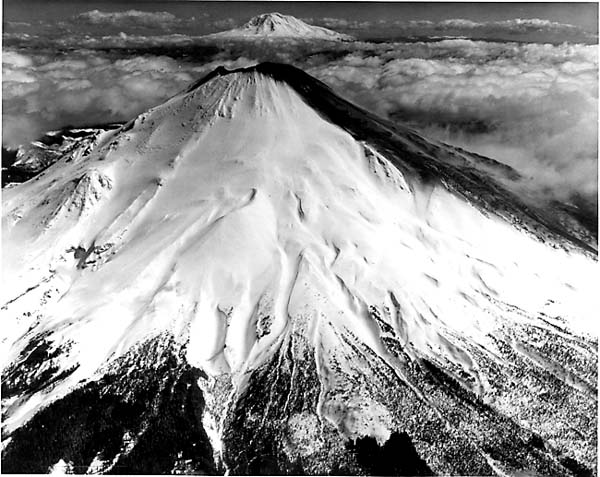
The earliest dated eruptions at MSH began some 40,000 years ago. Much of its growth to a composite stratocone reaching a pre-1980 altitude of 2975 m was accomplished in the last 4000 years. It experienced a strong eruption (4 km3 of airborne ejecta) around 1900 B.C. Its last previous pulse of intermittent activity fell between 1831 and 1857, in which a new summit crater and an exogenous dome were formed. Because its record indicated that MSH commonly experiences major activity every 100 to 200 years, an eruption before the close of this century seemed likely to the several geologists studying this volcano. This threatened to disfigure one of the most symmetrical of the Cascade stratocones. (See Figure V-5.2, and Figure V-8.1.)
| Figure V-8.1 | Figure V-8.2 |
|---|---|
 |
 |
The first sign of reawakening was a notable Earth tremor on March 20, 1980, followed by a steam and ash eruption on the 27th that produced a small crater by steam "reaming." Several phreatic eruptions, originating from the influx of snow meltwater into ascending magma, pulverized parts of the summit. That magma accounts for the gradual swelling (at 1 to 2 m per day) of the northern upper slopes as a magma pocket (or cryptodome) neared the surface. By mid-May, the bulge had risen about 150 m just above the 1857 Goat Rocks Dome, and reference points along it had shifted 100 m or more to the north.
| Figure V-8.3 | Figure V-8.4 |
|---|---|
 |
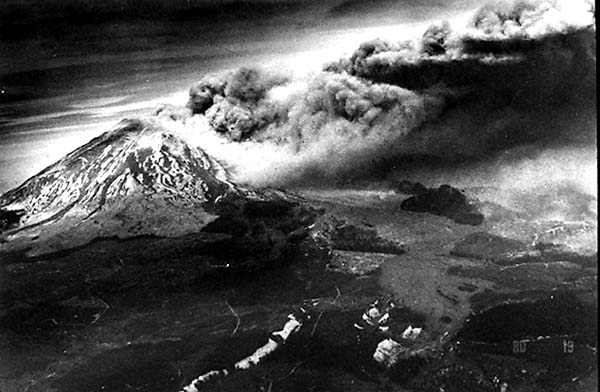 |
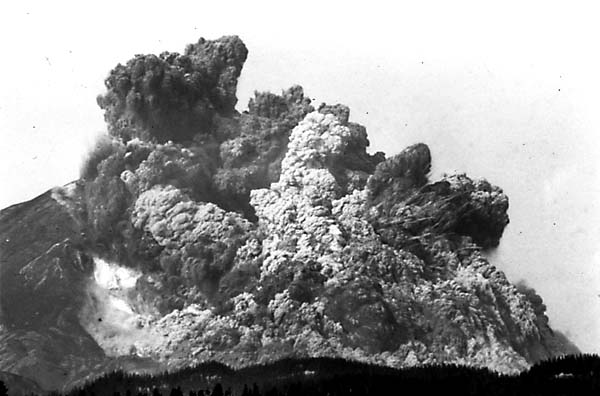
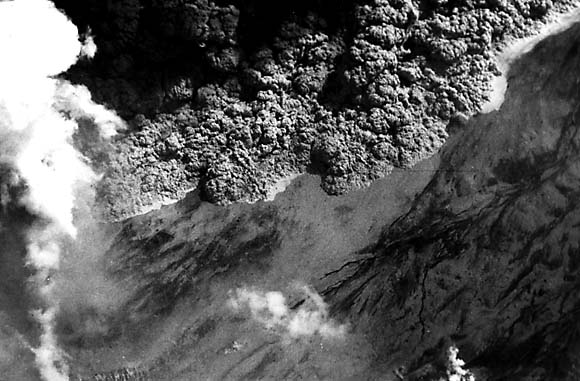
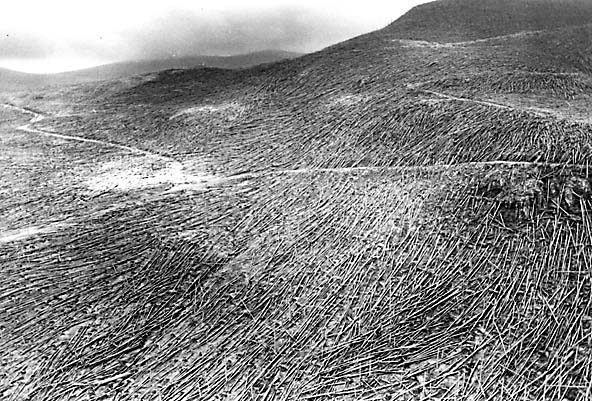
The catastrophic eruption of May 18 began at 8:32:20 PDT with a 5.l-magnitude earthquake that apparently triggered the next reaction some 15 seconds later -a massive landslide or avalanche that tore open the summit as weakened rock slid as a debris flow along a detachment plane. First to fail was ground around Goat Rock Dome, then a second mass that included the pre-eruption crater broke loose, and finally the remaining section of the summit dome itself slid away. At 8:32:41, the first of several expulsions of fragmented rock (some blocks of house size), ash, and steam emerged from the old crater vent and the new gash along the flank (Figure V-8.2). Part of the rising cloud and the lateral blast combined into a surge that proceeded downslope at speeds up to ~1000 km/hr, being directed mainly to the North Fork of the Toutle River, which flows west, and Spirit Lake to the north. The surge raced indiscriminately over rough terrain for the next 30 seconds (Figure V-8.3 and Figure V-8.4). Out to distances of about 12 km, the Direct Blast Zone is characterized by almost total tree upheaval from the dense coniferous forests along the slopes. Farther out to 19 km, the Channelized Blast Zone is marked by flattened tall trees, many of which fell like "matchsticks" in an array of parallel-aligned trunks (Figure V-8.5). For a few kilometers beyond, the lateral blast and surge singed trees in the Seared Zone.
| Figure V-8.5 | Figure V-8.6 |
|---|---|
 |
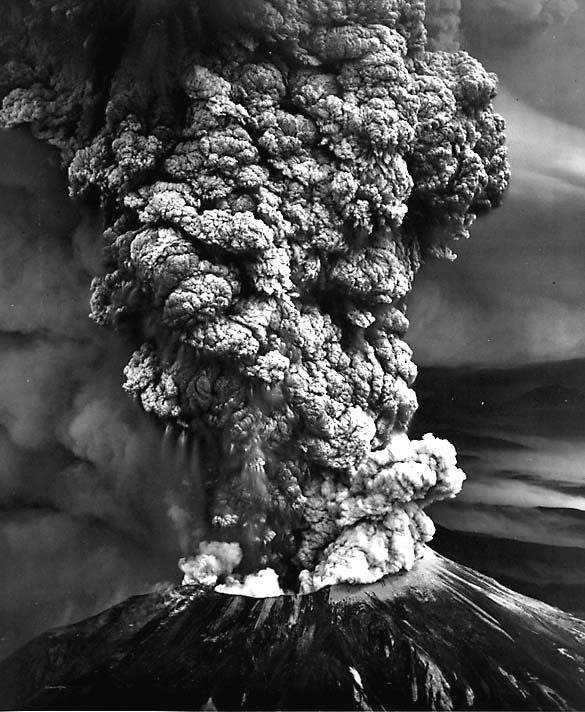 |
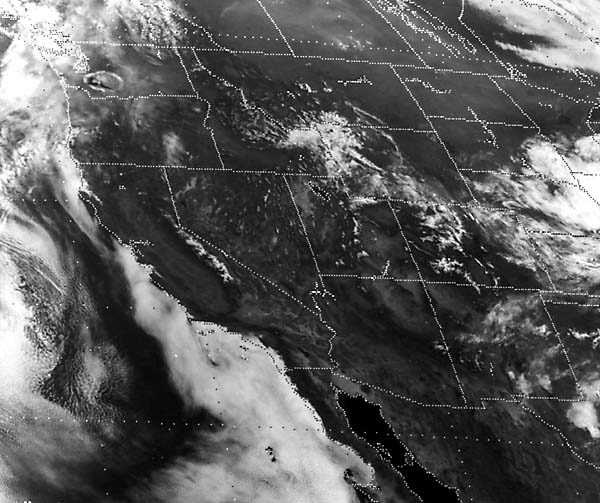
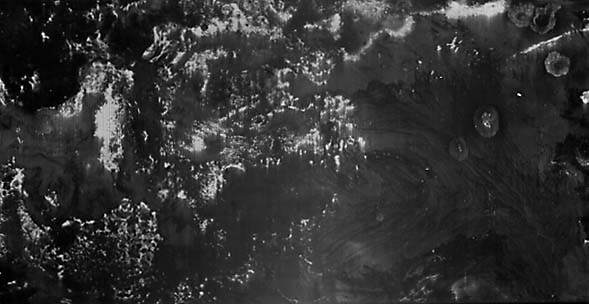
Within 10 minutes of the beginning of the eruption, a mushroom-capped ash plume had risen to 18 km, well into the stratosphere (Figure V-8.6). The dispersing first cloud and a later ejection of ash are evident in the NOAA Weather Satellite image (Figure V-8.7) taken shortly after noon PDT. Parts of central and eastern Washington and neighboring Idaho were quickly blanketed by 3 to 7 cm of fine powdery gray tephra. Measurable traces of ashfall were deposited as far away as Minnesota, New Mexico, and an isolated pocket in Oklahoma. All told, 540,000,000 tons of ash came to rest over about 55 000 km2. Fine tephra remained suspended in the upper atmosphere for several years.
| Figure V-8.7 | Figure V-8.8 |
|---|---|
 |
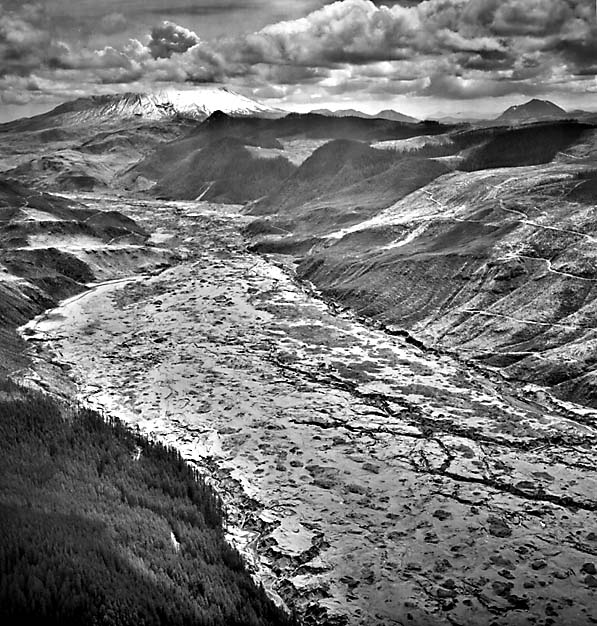 |
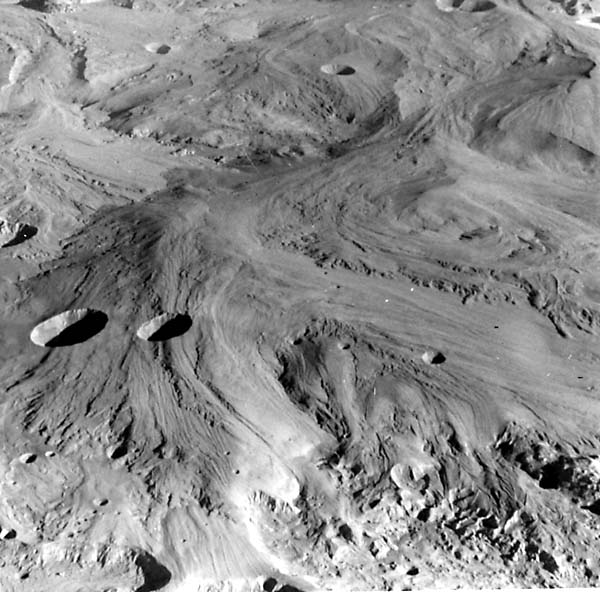
Mudflows (lahars), formed as volcanic debris mixed with steam and water, moved out from the slopes within the first 20 minutes into nearby drainage channels such as the North and South Forks of the Toutle River to the west (Figure V-8.8) and Pine Creek to the southeast. Even the navigation channel of the Columbia River downstream from the Toutle River/ Cowlitz River network was temporarily reduced from 13 to 4 m in depth by the choking mud debris. En route, mudflows may locally have surged up valley walls as much as 100 m, but their final deposits were much thinner. Phreatic craters (Figure V-8.9) formed where pyroclastic flows and lahars encountered pockets of trapped fluids.
| Figure V-8.9 | Figure V-8.10 |
|---|---|
 |
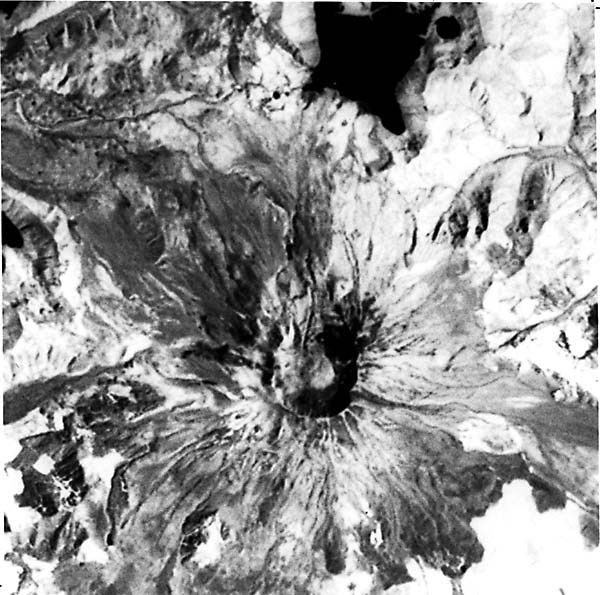 |
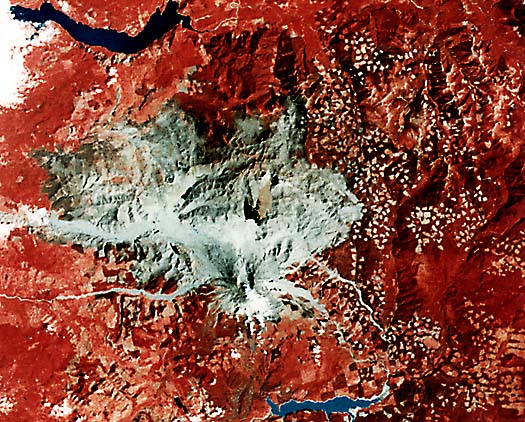
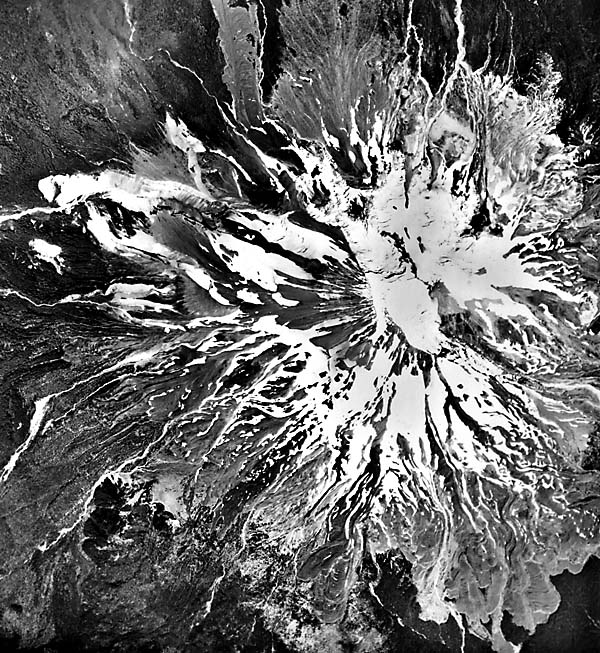
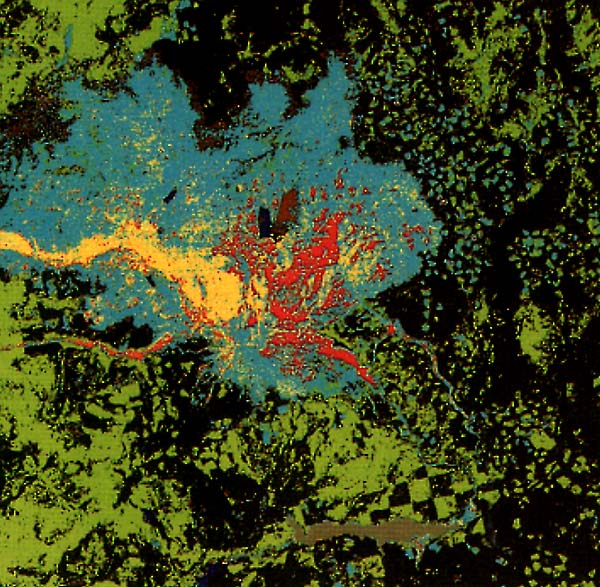
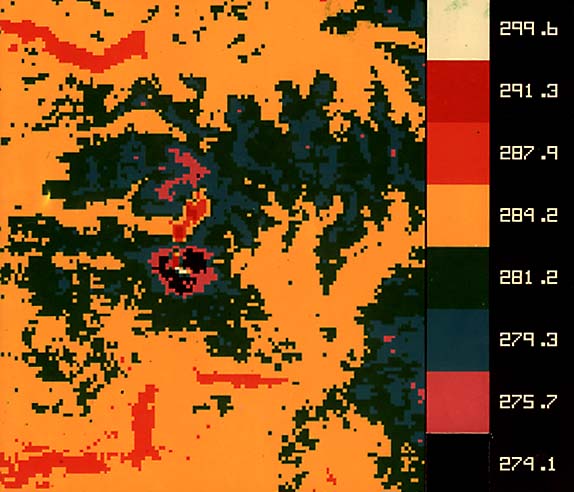
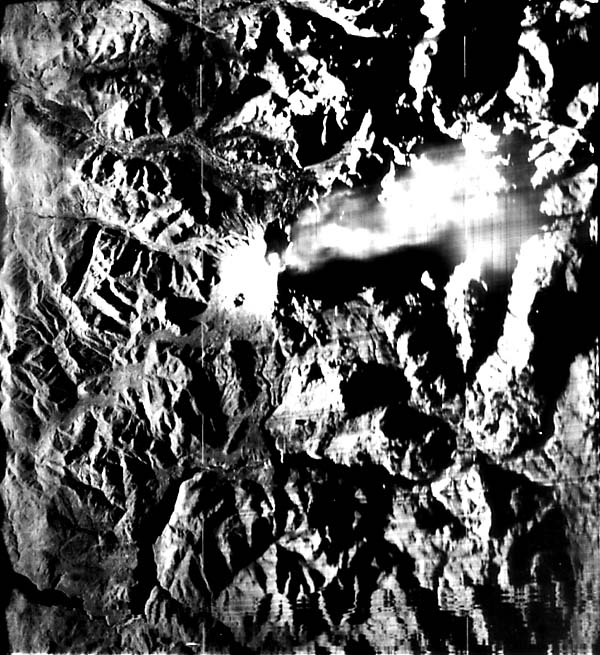
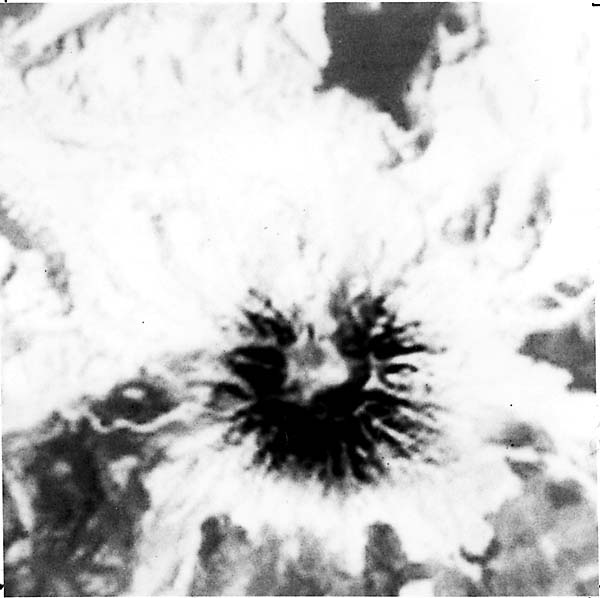
After the dust cleared, the devastation wreaked by the May 18 eruption could be fully appreciated. The highest remaining section of the upper peak is now 400 m lower than the original summit; the rock at that summit point was dropped about 1000 m to the crater floor. The avalanche and subsequent blast left a crater 680 m deep and 2 by 3 km wide, readily visible from space (Figure V-8.10). Dispersed deposits from the debris avalanche have an equivalent volume of ~2.8 km; another 1 km was entrained in the plume expulsions. The initial eruption devastated an area of about 20 by 30 km (east-west). The full extent of this damage, roughly coincident with the area of tephra deposits of 2 to 5 cm and thicker, is evident in the Landsat-3 image shown in the main plate. Multispectral Scanner (MSS) data from this July 31, 1980, scene were used to construct a supervised classification of several classes of deposits (Figure V-8.11); class colors are: blue = clear water; gray = silty (ash-laden) water; dark green = conifers; light green = other vegetation; aqua = ash-covered terrain, with trees down (also bare soil); purple = ash plus standing trees (deneedled); yellow = avalanche deposits; orange = mudflows; red = pyroclastic flows plus mudflows; and black = pumice flow. Earlier, the HCMM satellite obtained a thermal Night IR image of the MSH area on June 19, 1980. Using an internal calibration lamp within the sensor to estimate ground temperature, C. Bohn of NASA's Goddard Space Flight Center used a computer program to calculate a surface temperature distribution (Figure V-8.12). Highest temperatures (white-coded) occur at the crater and along a lobe (red) extending to Spirit Lake; lowest temperatures (black) are associated with snow still covering part of the peak. A thermal IR image (Figure V-8.13) made with an airborne sensor on July 22, 1980, shows surface temperature variations along a pyroclastic flow lobe. A remarkable airborne SLAR (X-band radar) image (Figure V-8.14) of MSH was obtained from a flight near the volcano just over 2 hours after it had erupted on May 18.
| Figure V-8.11 | Figure V-8.12 |
|---|---|
 |
 |
| Figure V-8.13 | Figure V-8.14 |
|---|---|
 |
 |
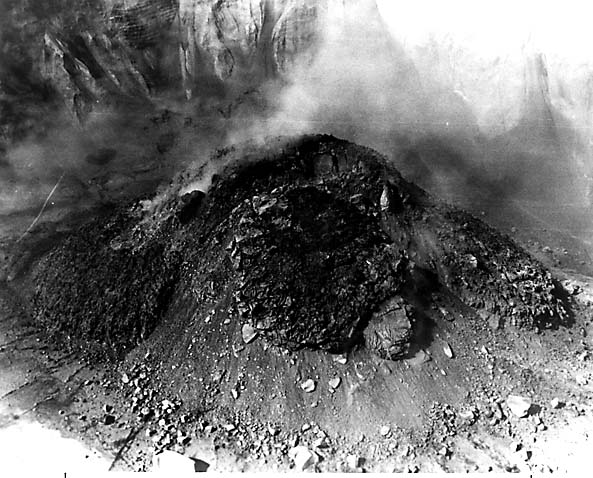
Mount St. Helens has continued to erupt through 1985. Another Plinean eruption took place on May 25, 1980, carrying ash toward Seattle, followed by still more smaller eruptions in June, July, August, and October. By the end of 1980, tephra in the devastation area had built to thicknesses of a half meter or more close in. By mid-June of 1980, a lava dome began to push up at the surface within the crater and has grown periodically to a height of 600 m since then (Figure V-8.15). The surface heat state of this dome in 1984 is depicted in a Thematic Mapper band 6 thermal image (Figure V-8.16). More than 800 m across, the dome is warmer than its surroundings.
| Figure V-8.15 | Figure V-8.16 |
|---|---|
 |
 |
By some standards, MSH was not a large explosive event. It compares with the 1586 eruption of Kelutin in Indonesia and Mt. Pelée (1902) on the Caribbean island of Martinique and was somewhat smaller than the famous 79 A.D. eruption of Vesuvius. It was much smaller (1 km3 of airborne tephra) than Crater Lake's Mt. Mazama (42 km3) or the great 1815 eruption of Tambora in Indonesia (80 km3) and was inconsequential compared to the welded tuff-forming eruptions in the Yellowstone region and at the Vanes Caldera in prehistoric times. Nevertheless, it remains in one sense the most spectacular of all famous eruptions in the thoroughness with which it has been recorded and studied. It is likewise a cogent example of how a dominantly constructional landform can convert almost instantly to one that has a look of total destruction around it. After only 5 years, however, the ecology around it has begun to revert to its past state. Caption modified from comments by N. H. MacLeod, USGS. Additional References: Foxworthy and Hill (1982), Tilling (1984), U.S. Geological Survey General Information Bulletin. Landsat Subscene, July 31, 1980.
Continue to Plate V-9| Chapter 3 Table of Contents.| Return to Home Page| Complete Table of Contents