
History of Remote Sensing: Examples of TM Imagery
Below are three examples of TM imagery in color. We refrain here from displaying any of the individual black and white TM bands because Section 1 presents and examines excellent examples of these from a subscene of of Morro Bay, California.
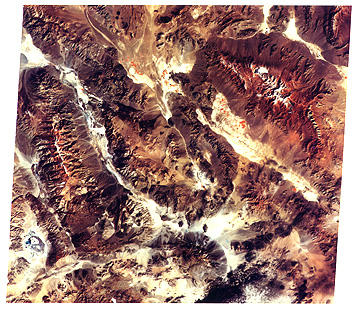
The first TM image is a late Fall, false color (TM bands 2, 3, 5 in blue, green, and red) rendition of mountain ranges in southeastern California and western Nevada. The large valley towards the left is Death Valley, with the Panamint Range to its left. The large range near the upper right is the Spring Mountains, whose reddish tones indicate vegetation (mixed evergreens and deciduous trees). The bottom of the image includes the north edge of the Mojave Desert.
I-24: Until you have gained familiarization by close inspection of TM full images, you may by inclined to think that they are not much better than corresponding MSS images. Ponder that; why? For what image situation(s) will the improved resolution really make a difference. ANSWER
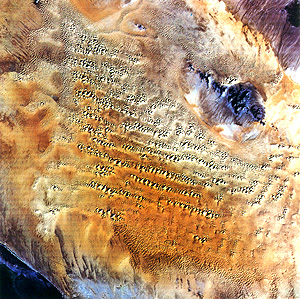
The second scene is an 80 km (50 mile) enlargement of part of a TM image covering the Sonoran Desert of northwest Mexico (a bit of the Gulf of California appears in the lower left), shown here in true color. Star and crescentic sand dunes dominate this subscene in this vast sand sea deposited over igneous lavas. The dark patches in the upper right are volcanic lavas but the dark mass to its southwest is the Sierra del Rosario, composed of granitic rocks.
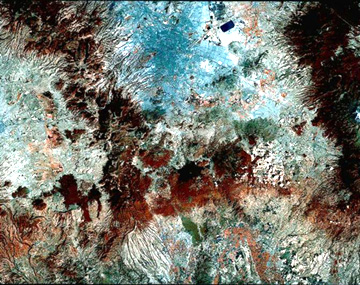
The third TM image is also a subscene, about 70 km (43 miles) on a side, in west-central Mexico. Mexico City, with the largest urban population in the western hemisphere (about 30 million), appears in this false color version as the medium blue area in the upper left part of the image. Note that its area is much less than that of Los Angeles (one of the opening scenes in Section 4), indicating a high population density, i.e., crowding. The city lies at an average elevation of 2800 meters (9184 feet) astride the Neo-Volcanic Plateau, a zone that runs across Mexico and is seismically active. Just off the image to the right is a cluster of active volcanoes including the famed Popocatepetl which is over 5100 meters (almost 17000 feet).
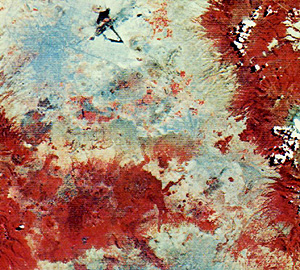
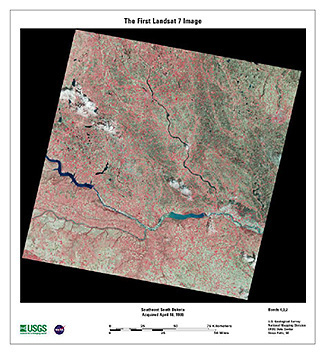
For comparison, we reproduced a map of roughly the same area as was imaged in 1973 by the first Landsat MSS. Draw your own conclusion about the relative details seen in the TM versus the MSS. Note that the size of Mexico City was not much smaller then even though its population was just over 7.5 million. The two images, when compared, illustrate the concept of change detection.
Landsat 7 has come on line in April of 1999 after its last working predecessor, Landsat 5 has continued to operate faithfully for 15 years (since 1984). Landsat 7 has only a single instrument, called the Enhanced Thematic Mapper (ETM+). This consists of the same 6 bands in the Visible and Near Infrared as the TMs, again at 30 m resolution. The thermal band has an increase in spatial resolution by a factor of 2 - to 60 meters. The new component is a panchromatic (0.52 to 0.90 µm) black and white sensor (somewhat analogous to the RBV) which images at a 15 meter spatial resolution. The Landsat 7 program is operated jointed by NASA Goddard Space Flight Center and the U.S. Geological Survey. Here are some representative scenes.
The first scene acquired by Landsat 7 covers a part of southeastern South Dakota that includes the city of Sioux Falls. The U.S. Geological Survey's EROS Data Center (EDC), where Landsat imagery can be inspected and ordered, lies just off the image to the right.
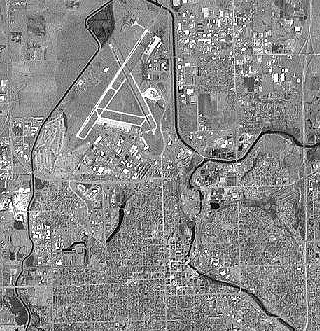
Part of the Landsat 7 panchromatic image of this same scene, showing a portion of Sioux Falls, with individual buildings now resolvable, is presented next.
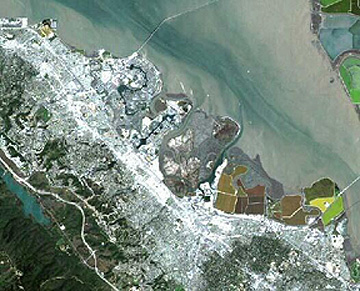
Another urban area is seen in this quasi-natural color subscene of the "Peninsula" area south of San Francisco. At the top is the San Mateo Bridge and Foster City (just beneath its west terminus), a residential area built on extensive fill into the San Francisco Bay, thus on newly created land. The Dumbarton Bridge near the bottom right leads into Palo Alto, home of Stanford University. Note the salt pans to the left of the bridge. The lake - actually the Upper Crystal Springs Reservoir - near the bottom left lies right on top of the infamous San Andreas Fault Zone. The nearby road (a 100 feet or so higher) is Interstate 280.
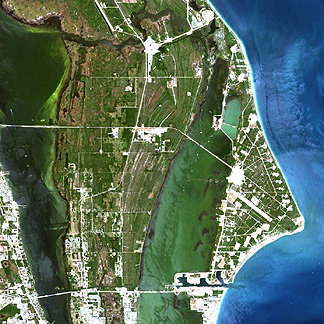
Finally, an early subscene shows the Cape Canaveral area of the east-central coast, where NASA's Kennedy Space Center (KSC) is located. Note the many individual launch sites. Compare this image with the RBV image of the same location shown near the bottom of I-15.
Goddard maintains a Landsat web site that now features a selected group of Landsat 7 images. Other information on Landsat 7 is included in the site established by the U..S. Geological Survey.
For those interested in the history of the Landsat program, click on this 11 page summary : http://geo.arc.nasa.gov/sge/landsat/lpchron.html. This Chronology was prepared for NASA at its Ames Research Center. They also maintain a general information bulletin board on Landsat (which includes the above historical perspective) that you can access at http://geo.arc.nasa.gov/sge/landsat/landsat.html.

Collaborators: Code 935 NASA GSFC, GST, USAF Academy Webmaster: Bill Dickinson Jr.
Primary Author: Nicholas M. Short, Sr. email: nmshort@epix.net
Contributor Information
Last Updated: September '99
Site Curator: Nannette Fekete
Please direct any comments to rstweb@gst.com.