
Electromagnetic Spectrum: Distribution of Radiant Energies
The distribution of the continuum of radiant energies can be plotted either as a function of wavelength or of frequency in a chart known as the electromagnetic (EM) spectrum
Over the years, scientists divided the EM spectrum into regions or intervals and applied descriptive names to them. At the very energetic (high frequency and short wavelength) end are gamma rays and x-rays (whose wavelengths are normally measured in angstroms [Å], which in the metric scale are in units of 10-8 cm). Radiation in the ultraviolet extends from about 300 Å to about 4000 Å. It is convenient to measure the mid-regions of the spectrum in one of two units: micrometers (µm), which are multiples of 10-6 m or nanometers (nm), based on 10-9 m. The visible region occupies the range between 0.4 and 0.7 µm, or its equivalents of 4000 to 7000 Å or 400 to 700 NM The infrared region, spanning between 0.7 and 100 µm, has four subintervals of special interest: (1) reflected IR (0.7 - 3.0 µm), and (2) its film responsive subset, the photographic IR (0.7 - 0.9 µm); (3) and (4) thermal bands at (3 - 5 µm) and (8 - 14 µm). We measure longer wavelength intervals in units ranging from mm to cm. to meters. The microwave region spreads across 0.1 to 100 cm,which, includes all of the interval used by radar systems. These systems generate their own active radiation and direct it towards targets of interest. The lowest frequency-longest wavelength region beyond 100 cm is the radio bands, from VHF (very high frequency) to ELF (extremely low frequency). An enlarged figure, from which the one above was derived, indicates many of the atomic or molecular mechanisms for forming these different types of radiation.
I-8: Given that 1 nanometer (NM) = 10-9 m, 1 micrometers = 10-6 m and 1 Angstrom (A) = 10-10 m, how many nanometers in a micrometer; how many Angstrom units in a micrometer? ANSWER
Here is a generalized diagram showing relative atmospheric radiation transmission of different wavelengths.
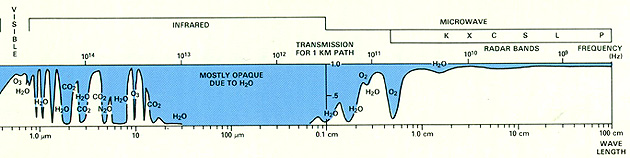
Blue zones mark minimal passage of incoming and/or outgoing radiation, whereas, white areas denote atmospheric windows, in which the radiation doesn't interact much with air molecules and hence, isn't absorbed. Most remote sensing instruments on air or space platforms operate in one or more of these windows by making their measurements with detectors tuned to specific frequencies (wavelengths) that pass through the atmosphere. However, some sensors, especially those on meteorological satellites, directly measure absorption phenomena, such as those associated with carbon dioxide, CO2 and other gaseous molecules. Note that the atmosphere is nearly opaque to EM radiation in part of the mid-IR and all of the far-IR regions. In the microwave region, by contrast, most of this radiation moves through unimpeded, so radar waves reach the surface (although raindrops cause backscattering that allows it to be detected).
I-9: From the above figure, list the four principal windows (by wavelength interval) open to effective remote sensing from above the atmosphere. ANSWER

Collaborators: Code 935 NASA GSFC, GST, USAF Academy Webmaster: Bill Dickinson Jr.
Primary Author: Nicholas M. Short, Sr. email: nmshort@epix.net
Contributor Information
Last Updated: September '99
Site Curator: Nannette Fekete
Please direct any comments to rstweb@gst.com.