
Consider this diagram (adapted from one from the U.S. Geological Survey, so that here and in subsequent maps we use English units exclusively):
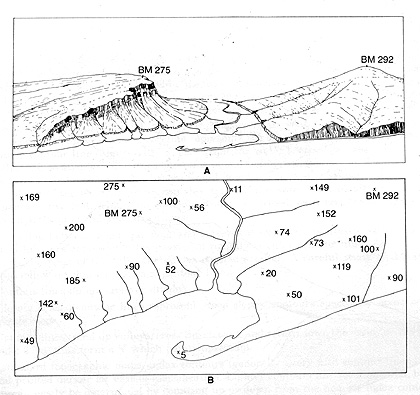
The upper view is a perspective drawing of a coastal landscape, consisting of a shoreline, including a barrier spit (hooked sandbar), a river valley (with bluffs), and two hills. One hill has an inclined tabular slope, bounded by a steep cliff that grades into a terrace, and the other has a crest point, from which extend several ridges between stream cuts.
In the lower view are a set of surveyed points with their elevations, starting from the coast at 0 ft sea level, up to two benchmarks (BM) atop the hills. This is typical raw data, from which we can draw contours. The contour-drawing procedure relies on interpolation of values set by the chosen contour interval of 20 ft between pairs of survey points. To see how, print out the above diagram. Start with the two points at 52 and 90 ft (left of panel center). Draw a light line from one to the other. Assuming equal spacing, place a short mark (say, a dashed line) across the light line, valued at 60 ft just left of the 52-ft mark, then another at 80 feet. Estimate these locations as if there were a constant slope from the 52 ft mark to the 90 ft mark. Imagine dividing that slope into 38 1-ft units and the two short lines lie at 8/38th (60 ft mark)and 28/38th (80 ft mark) upwards from the 52 ft point.
Using the same equal spacing approach, along a path to the coast between 52 ft and 0 ft, draw short lines at 12/52ths (40 ft mark) and 32/52ths (20 ft mark). You can do the same interpolation between the 100 ft and 56 ft points (near top center), and likewise for any other pair of points. This process leads to a large number of interpolation lines of different contour (elevation) values. Now, similar to the parlor game of connecting the dots, connect the various short contour line marks with the proviso that they cannot cross one another. Your result should look like this:
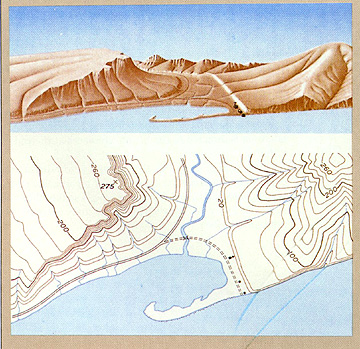
Note three other characteristics (besides non-crossing) of contour lines: 1) the gentler the slope, the wider the spacing between lines (very closely spaced lines denote a cliff) 2) where lines cross a stream, they must bend upstream (remember, a stream moves directly downslope and therefore we must walk horizontally to cross it and get to the same elevation point on the other side) and 3) by convention, we draw every fifth line in a heavier weight-for the contour interval in this case that is at 100 ft and 200 ft.
11-5: There is one topographic situation which, if represented by contours, involve some of the contours crossing over others. Can you think of what this might be? ANSWER
Note, too, that on most maps, contours are brown. We illustrate this on this part of a larger topographic map:
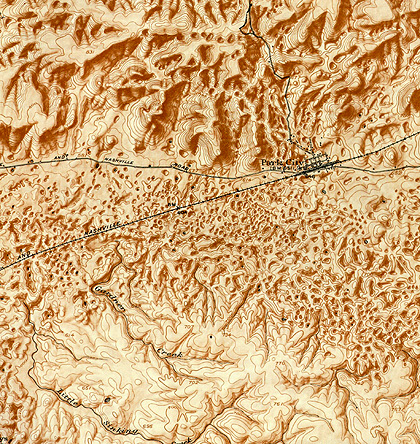
This map covers the region just south and east of Mammoth Caverns in Kentucky (below the surface in the upper left). The upper third of the map, judging from the 20-ft contour spacing and the shapes outlined by the contours, is an area of rolling hills with several hundred feet of moderate relief (relief refers to the amount of difference in elevation between two points; low relief implies relatively flat terrain, while high suggests steep slopes), with narrow stream valleys. We enhance the hilly appearance using a technique sometimes used by map makers of shading (here in uniform brown) steep slopes on one (and the same) side of the hills. In the map center are large numbers of nearly circular contours, and each grouping is quite small. These mark the sites of sinkholes. This is limestone country in which the so-called karst topography develops by solution and downward draining of the bedrock. The lower third of the map resembles the upper but with notably less relief.
Now, as an exercise to test your ability to associate surface shapes by contours, look at this next map.
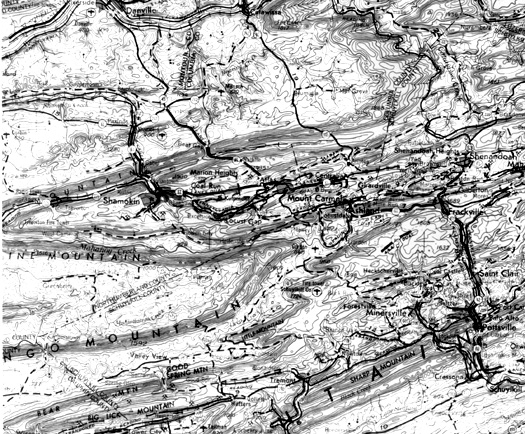
11-6 Try to determine which scene in Section 6, the cross-country flight, contains landforms similar to the ones you should visualize from the map. The map area is not in that scene but lies just to its east (next Landsat orbit to the right).. ANSWER

Primary Author: Nicholas M. Short, Sr. email: nmshort@epix.net
Collaborators: Code 935 NASA GSFC, GST, USAF Academy
Contributor Information
Last Updated: September '99
Webmaster: Bill Dickinson Jr.
Site Curator: Nannette Fekete
Please direct any comments to rstweb@gst.com.