
These data sets have important applications. They allow for rapid reconstruction of contour maps and for plotting elevation profiles. Also, we can easily do various kinds of photogrammetric calculations with the numbers. Image processing systems can edit and filter these data to enhance the display products and merge data sets into larger maps. We can present surfaces as X-Y-Z plots, where the Z dimension appears as regularly spaced vertical lines whose lengths are proportional to elevation. These plot are available in several formats:
Shaded relief maps, in which we assign different shades of gray to slopes, depending on elevation, or a variant, in which we assign shadowing to selected slopes depending on their orientation (aspect) and on sun direction and azimuth. By shifting these parameters, we create different renditions that bring to light different surface features and trends.
Color density slices, in which we color-code elevations.
Perspective Views. Since we can readily calculate geometric variables, such as orientation and height from the digitized data, we can recreate the surfaces to look like oblique photos. We can easily examine such surfaces from different perspectives by rotating the view horizontally (along a vertical axis) or changing the look angle.
Draped Views. The ultimate display is usually one in which we register or "drape" a surface image, such as a Landsat scene, onto the DEM array (data cells match with pixels), causing that surface and the features on it to appear in some form of 3-D display (e.g., in a perspective view or by creating pseudo-stereo pairs as a stereo model). We can also convert various thematic maps, as for example, land use, urban structure, or geology into 3-D mode.
Examples of these DEM-based products abound on the Internet. Next, we show just a few that are typical:
Check first this gray level relief map, constructed from 1:250,000 DEM data, of the Susanville area in the Sierra Nevada Mountains:
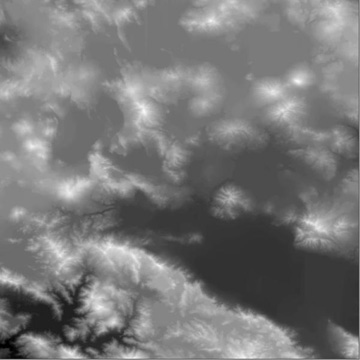
11-13: Describe what you think you are seeing in the map. ANSWER
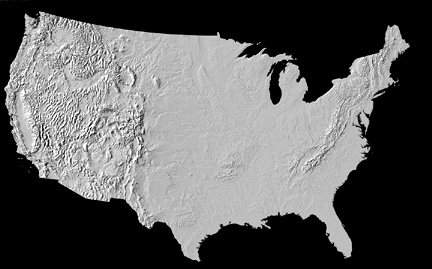
Next, examine the variant, in which shadow effects emphasize relief, by switching to a grand scale view of the entire conterminous U.S. Locate your home area.
An excellent example of a map, in which the elevations are color-coded, is this DEM version showing the state of Wyoming. The data source is a series of 30-second digitized maps. Lower areas are in green, and higher are in yellows, then brown.
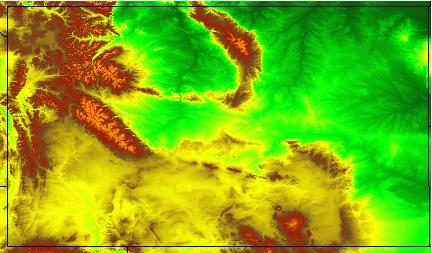
11-14: Find the features in the Wyoming map in the topographic map of the entire U.S. ANSWER
Let's now peer at a spectacular scene, looking at the Grand Canyon, as shown in a perspective view developed from DEM data and artificially colorized to resemble the rock units. But first, to gain familiarity with this incredible "ditch," carved over millions of years by the Colorado River, examine this Landsat subscene. The snow-covered area is the Kaibab Plateau, some 2000 feet higher than the South Rim.
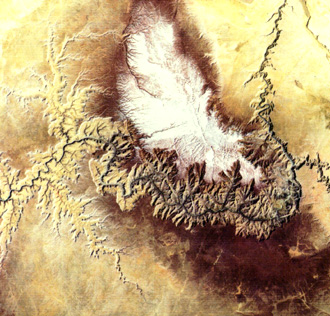
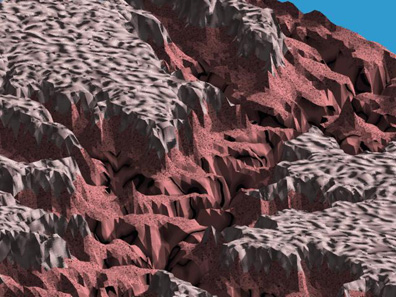
11-15: Try to locate the oblique perspective scene in the Landsat view. ANSWER

Collaborators: Code 935 NASA GSFC, GST, USAF Academy Webmaster: Bill Dickinson Jr.
Primary Author: Nicholas M. Short, Sr. email: nmshort@epix.net
Contributor Information
Last Updated: September '99
Site Curator: Nannette Fekete
Please direct any comments to rstweb@gst.com.