The Hydrologic Cycle; Meteorological Satellites (General)
Oceans and large freshwater bodies cover more than 70% of the Earth's surface. At any moment, around 50% of that surface, land and sea, is hidden from satellite view by clouds. Over smaller areas, but still significant, rain, descending from these clouds, impacts on the surface to run off and then coalesce into streams and rivers. This great system of interconnected water circulation comprises the hydrologic cycle, as summarized in this diagram:
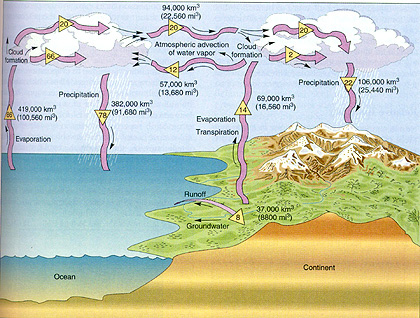
(Christopherson, R.W., GEOSYSTEMS: An Introduction to Physical Geography, 2nd Ed. © 1994. Reproduced by permission of Prentice Hall, Upper Saddle River, New Jersey)
14-1: What in the diagram accounts for the least amount of water relocation? What category of temporary water storage is not cited in the diagram? ANSWER
The numbers associated with this chart clearly demonstrate that the oceans not only hold the bulk of the planet's water but are the source of most of the precipitation that constantly recycles water. Water in transit appears as circulating (wind-driven) visible clouds and invisible water vapor or as water mobilized in fluvial systems. In addition to the ocean bulk, which accounts for nearly 98% of the volume of water at or near the Earth's surface, most of the remaining fraction is ice, mostly in the Antarctic and Greenland, snow (much being seasonally ephemeral), and freshwater lakes.
The advent of satellites after Sputnik (in 1957) opened large regions in sweeping vistas for directly observing weather systems, oceanographic conditions, and water runoff on continents and islands. We could easily combine a series of adjacent scenes, acquired during short time periods, in mosaics to give global coverage on a daily basis. In time, satellites placed in geosynchronous orbit afforded nearly instantaneous coverage of hemispheres of the Earth that could rapidly update views of cloud decks and circulation patterns over almost any part of the world. Ironically, the very thing that compromises observations of the land and open ocean, namely clouds, is the prime target of meteorological satellites (metsats). As more versatile sensors evolved, they quantitatively monitored various other atmospheric or oceanographic properties, such as the stratosphere, tropospheric temperatures, Earth radiation budget, air chemistry (e.g., ozone, CO2, sulphur compounds, and aerosols), wind and sea current movements, sea-ice, and marine biotic nutrients.
14-2: What spatial attribute of a sensor system is highly desirable in a meteorological satellite? ANSWER
From 1959 through 1994, many countries launched satellites (approximately 270–a few failed), such as the United States, the former Soviet Union/Russia, Japan, China, India, Italy, France, and the European Space Agency, primarily to provide current timely data for weather system monitoring and forecasting but also to conduct scientific studies to better understand the atmosphere, the oceans, the Earth's force fields (ionosphere and magnetosphere), solar radiation, and related aspects of the environment. In contrast, so far, they dedicated only 25 other satellites to land observations. Astronauts conducted meteorological experiments during Mercury, Gemini, Apollo, Shuttle, and Mir flights. Clearly, the most widespread applications to date of remote sensors operating from space platforms have been to image water in its main functions in the Earth System.
To most of the general public, including many in the technical fields, the one incursion of Earth-observing satellites into everyday life comes during the Weather segment of the TV news. We are familiar with synoptic views of clouds over our home region, as well as panoramas across the continent in which we live. These weather maps usually come from visible and thermal IR bands on sensors mounted in geostationary satellites. Even more common are images made by ground-based Doppler radar systems that sweep circular pattern. Radio signals bounce off (are scattered by) particulates, such as raindrops or ice, and return to the antenna, yielding estimates of precipitation amounts and wind speeds (using the Doppler principle [see Section 8], in which frequencies increase [decrease] as the reflecting particles move towards [away from] the radar site). Currently, in the U.S., the National Oceanographic and Atmospheric Administration's (NOAA) National Weather Service operates most weather radars. Their Next Generation Radar (NEXRAD ) network consists of S-band radars at 164 stations across the country. This system especially detects and warns of severe storms, tornadoes, and flood-generating heavy rains. Here are two examples: cloud patterns on the top and precipitation on the bottom, for the 48 states, downloaded from the Accuweather site (http://www.accuweather.com). on the day this paragraph was written.
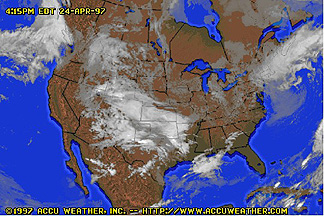
By arranging frequent observations into a time-lapse sequence (usually over an interval of the last 6 to 24 hours), the system creates and displays a " movie" of advancing weather systems from local to continental scales. .
14-3: What particular types of weather maps or images do you remember seeing on the Weather segments of the local news shows you watch on TV? ANSWER
Section 14 reviews the history and accomplishments of this use of satellites to monitor the daily changes of the Earth's weather systems, oceans, rivers, and snow/ice and to conduct long-term research into the interactions of the atmosphere and hydrosphere that control the meteorological state of the planet. This subject is vast-worthy of its own web site-and many web sites now exist, as you can ascertain by doing a internet search. We introduce only a digest of the types of observations-mainly by presenting images and a few graphs-in this brief, simplistic, and generalized treatment. We emphasize meteorological applications, with an abbreviated summary of selected oceanographic (surface temperatures, seastate, currents, and phytoplankton distribution) and hydrologic (flooding, water storage, and drainage regime) uses. Many people working through this tutorial may lack knowledge in meteorology, and even more so, in oceanography and hydrology. For those who seek a broad overview, or wish to delve into greater technical and scientific details, we suggest perusal of a good introductory Meteorology or Oceanography text or, better yet, the relevant chapters in a Physical Geography text, such as:
In addition, EuroMET prepared a website course on Satellite Meteorology. To access this site, you must first get a user name and password through this URL address, (http://euromet.meteo.fr/). When there, click on Satellite Meteorology.

Primary Author: Nicholas M. Short, Sr. email: nmshort@epix.net
Collaborators: Code 935 NASA GSFC, GST, USAF Academy
Contributor Information
Last Updated: September '99
Webmaster: Bill Dickinson Jr.
Site Curator: Nannette Fekete
Please direct any comments to rstweb@gst.com.