
Seasat, Topex-Poseidon, and NSCAT
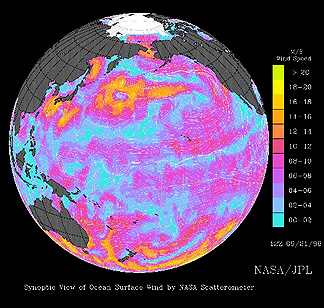
Temperature variations are major factors in the development, strength, and directional behavior of moving atmospheric gases (winds). Their prevailing motions change over time, but tend to follow certain preferred paths in various parts of the world. We determine wind directions indirectly, by relating them to the patterns of waves they produce, especially in the open seas. Data from the scatterometer on Seasat helped to generalize wind patterns over the Pacific Ocean, shown in this image:
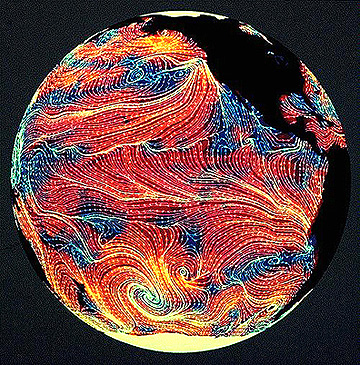
14-29: Why do we want to know about wind patterns? ANSWER
Seasat was the first U.S. satellite that, as an original intention, had as its primary mission, monitoring oceanic surface phenomena, such as sea state (surface wave parameters, including wavelength, period, and height), surface wind fields, internal waves, currents and eddies, and sea ice characteristics. The microwave systems on Seasat were described in Section 8 (Harrisburg, Pennsylvania Radar Polarization). Radar images from Seasat over land surfaces proved so invaluable that the impression may be that we subordinated the marine applications. Nevertheless, the system performed well as intended and we gleaned much information about the oceans during its 98 days of service in 1978, before an electrical short circuit disabled it.
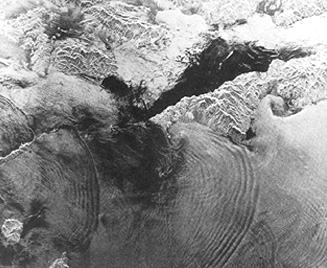
Operating at a high depression angle (67 to 73°) to optimize wave detection , the L-band radar on Seasat (with its 25-m resolution) provided some exceptional images of ocean waves. We show an enlarged image of the North Sea to illustrate this:
14-30: How many directions of advancing waves can you detect in the above image? ANSWER
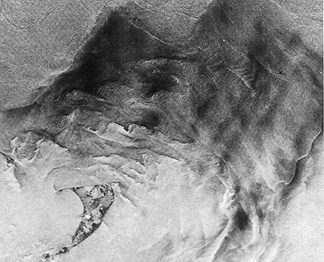
This image requires careful inspection. You should see a dominant set of numerous closely-spaced waves, trending East-North-East, arranged in patches that give a linear grain to the image. There is a second well-developed NW set of similar dimensions. Several clusters of large, curved, widely-spaced waves may be internal waves. Internal waves in shallow waters in the Gulf of California appear in the next Seasat image on the left (north is towards the lower right). Surface wave expressions related to variations in bathymetric depths are evident in the right Seasat image (north to upper left), showing the Nantucket Shoals off Rhode Island. Nantucket Island is at the bottom left.
We described the Topex-Poseidon mission, run by JPL, in Section 8. W e suggest you access this outstanding tutorial (http://topex.www.jpl.nasa.gov/education/ tutorial1.jpg) prepared by the Topex-Poseidon team, which explores the kinds of information that radar altimetry and scatterometry can acquire.
Topex-Poseidon uses two radar altimeters to measure distance from the satellite to the sea's surface (to a precision of 4.3 cm). From such data, we derive global maps that show Dynamic Ocean Topography (rises ["hills"] and depressions ["valleys"]), Sea Surface Variability, Wave Heights, and Wind Speeds. A separate microwave radiometer on this mission determines Precipitable Water Vapor, which allows for corrections in the pulse transit time to improve distance accuracy.
14-31: How would T-P determine wind speeds from the observables? ANSWER
The first Topex-Poseidon maps we examine show ocean topographic variations. Below is a plot of large-scale variations during September 1992 in ocean elevations relative to the Earth's geoid. The data used to construct the map come from other sources, such as gravitational perturbations of satellite orbits. Note that, as much as 150 m (492 ft) of relief exist on the seas between the Atlantic Ocean (lower, green) and the western Pacific (higher, orange-red).
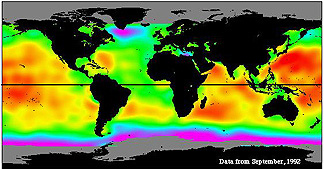
14-32: Where are the oceans the highest? ANSWER
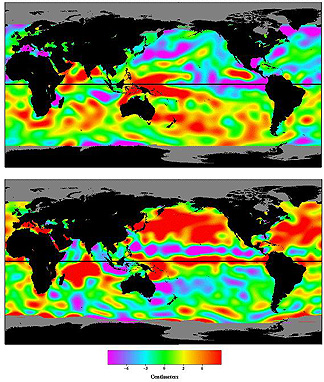
Seasonal differences do occur because of departures from the norms in height, as water expands or contracts in each hemisphere. The pair of maps below show Sea Surface Variation (SSV) in the northern Fall (upper) and Spring (lower), in a plot centered on the Pacific Ocean. The differences in elevation lead to redistribution of water through thermally-induced currents.
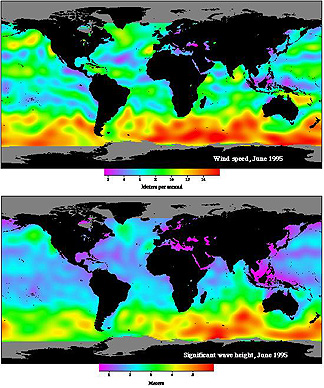
The next pair of maps are plots of wind speeds and wave heights during June 1995. There is some correlation between these parameters: greater speeds tend to cause higher waves.
A follow-up to Topex-Poseidon, named JASON-1, is a component of the EOS program discussed in Section 16
The Jet Propulsion Laboratory (JPL) developed, in cooperation with Japan's NASDA, a follow-on instrument to the Seasat Scatterometer, called NSCAT (NASA Scatterometer). This flew as part of the multiple payloads on ADEOS, launched from Japan on August 16, 1996, and operated successfully for 9 months. The view below shows the sophisticated nature of this satellite:
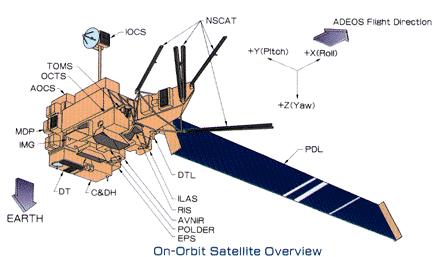
NSCAT was a microwave radar scatterometer that transmitted pulses at 13.995 GHz and measured their reflections (backscatter) from ocean ripples and other surfaces. Six antennas provided eight beams that extended over two wide bands. The returned signal received Doppler processing. Operating at 50 km spatial resolution, the system distinguished and recorded 268,000 wind vectors, derived from wave-induced backscatter data.
The principal use for NSCAT was in determining wind-direction, from which we derived useful information relative to global climate patterns. The instrument could also operate over land (see Sections 3-5) and produce sea-ice images (page 14-12). Here is a global, wind-vector map, color coded for different velocities.

Primary Author: Nicholas M. Short, Sr. email: nmshort@epix.net
Collaborators: Code 935 NASA GSFC, GST, USAF Academy
Contributor Information
Last Updated: September '99
Webmaster: Bill Dickinson Jr.
Site Curator: Nannette Fekete
Please direct any comments to rstweb@gst.com.