
Ice Monitoring
Our final look at satellite use in oceanographic monitoring concerns sea ice, which normally occurs year round in the polar regions but to varying extents. Polar orbiting satellites repeatedly pass near the poles on a daily cycle. Visible and radar imagery is effective in observing sea ice on a continual basis. Radar at bands that penetrate clouds (e.g., L-band) is now operational (Canada's Radarsat, for example) to monitor shipping lanes subject to ice hazards. Below is a SIR-C multiband color composite that shows ice in the Weddell Sea, off Antarctica, south of the Atlantic Ocean. Open water, called polynas, shows as darker tones.
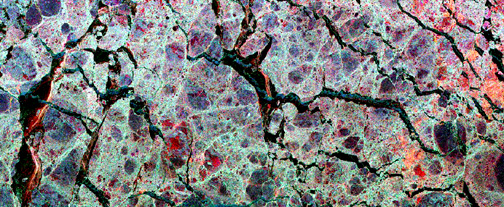
14-36: Why does this ice show a blocky or patchwork pattern? ANSWER
As the ice forms seasonally, the growing pack can take on swirl patterns caused by eddy-current circulation, as seen in this SIR-C image:
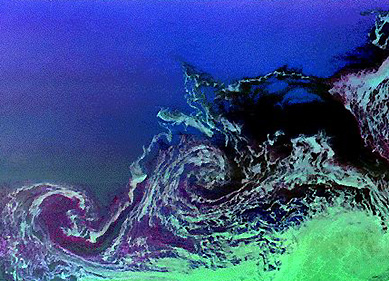
14-37: Which way are the ice eddies swirling? ANSWER
We see the nature of ice packs in the Arctic, over a large area, in this HCMM-Visible image of the Chukchi Sea in the Bering Strait between Alaska and Siberia. The ice in this scene has a network of cracks, called leads, which open during summer breakup and refreeze when conditions demand.

Next, we show the growth and shrinkage of the ice fields surrounding Antarctica as sensed by ESMR that appeared earlier in this section. Below these images are SMRR images that show changes in the ice cover for four years, during the 1978-86 period, in the top diagram. On the bottom is a view of the north polar regions, showing the prevailing ice cover, made by NSCAT (the NASA Scatterometer).
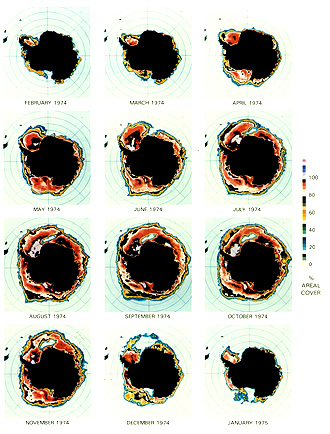
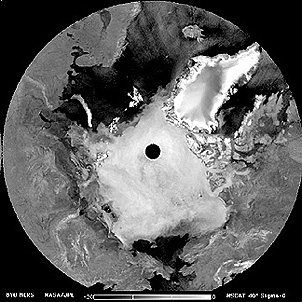
14-38: In the upper of these two diagrams, why is ice minimal in December? In the lower diagram, what is ice-covered besides the Arctic Ocean? ANSWER
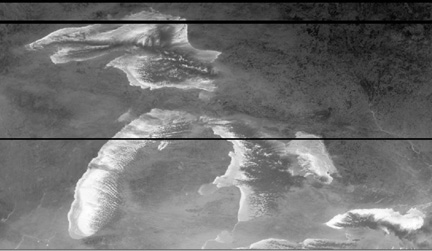
In the U.S., winter ice on the Great Lakes becomes a major impediment to shipping and usually some or all of the lakes close to normal travel. The AVHRR on NOAA satellites daily monitors the status of ice cover , giving results like this thermal IR image, made on January 31, 1996 (ice is light-toned; clouds appear very dark):

Primary Author: Nicholas M. Short, Sr. email: nmshort@epix.net
Collaborators: Code 935 NASA GSFC, GST, USAF Academy
Contributor Information
Last Updated: September '99
Webmaster: Bill Dickinson Jr.
Site Curator: Nannette Fekete
Please direct any comments to rstweb@gst.com.