
ESSA, DMSP, SSM/I; TRMM
The first U.S. operational metsats were the ESSA 1-9 series flown for the Environmental Science Service Administration (predecessor to NOAA) that began on February 3, 1966, and ended on February 26, 1969. The AVCSs and APTs were the prime sensors. Hurricanes and cyclones were special targets that ESSA routinely monitored from early to final stages of development and movement, which weÕll treat in some detail later in the section. Here is a view taken on September 1, 1966, of Hurricane Faith as it moved towards Cape Hatteras on the North Carolina coast.
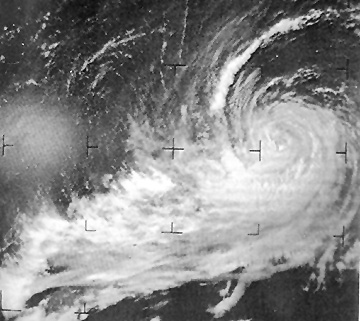
14-12: What's missing in this image? ANSWER
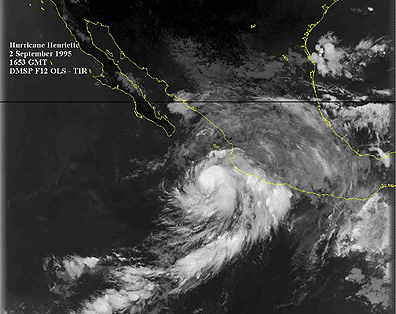
The U.S. Air Force program in meteorology, essential to its military operations, began with the launch of the first Defense Meteorological Satellite Program (DMSP) satellite on September 16, 1966. The principal instrument was the Operational Linescan System (OLS), which imaged in the visible and thermal IR (TIR) regions. This program, involving many launches in several series, continues today, and much of its data are declassified. Below is a TIR image of Hurricane Henrietta, spawned in the East Pacific, which struck the west coast of Mexico on September 5, 1995.
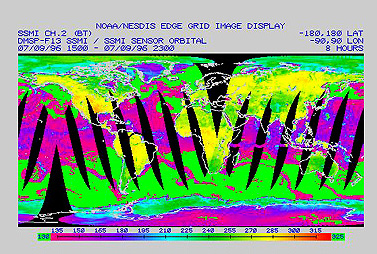
Later DMSPs also carried the Special Sensor Microwave Imager (SSM/I), which measures vertically- and horizontally-polarized radiation at 19.36, 22.23, and 85.5 GHz and horizontally at 37.0 GHz. Here is a global brightness temperature map, derived from Channel 2 data for July 9, 1996:
This sensor, a kin to SMMR, detects rainfall and clouds, such as displayed in this world map, showing Total Precipitable Water (in g/cc), determined from SSM/I data, for September 3, 1987:
14-13: Why is the green in the above map where it is? ANSWER
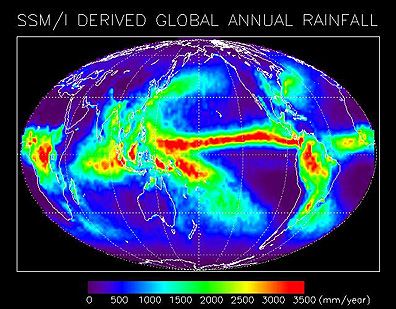
Over the course of a full year, we can average SSM/I readings to provide a global map that summarizes annual rainfall (in millimeters), as presented in this example:
The first satellite whose primary mission is to measure precipitation is the Tropical Rainfall Mapping Mission (TRMM), a joint research project between the U.S. (NASA) and Japan (National Space Development Agency: NASDA). A basic objective of TRMM is to obtain estimates of the vertical profile of the latent heat (heat resulting from a change of state), released through condensation of water vapor in the atmosphere, especially in the Equatorial Intertropical Convergence Zone (ITCZ). The TRMM is a large spacecraft that a joint engineering team built at NASA's Goddard Space Flight Center and successfully launched in Japan on November 27, 1997. The TRMM Observatory has three primary instruments:
In addition, the spacecraft's load includes the Lightning Imaging Sensor (LIS) (at 0.777 mm wavelength) capable of picking out lightning flashes associated with active rainfall and the Clouds and Earth's Radiant Energy System (CERES), a broad-band, scanning radiometer, designed to measure reflected and emitted radiative energy at the surface and for the atmosphere and its constituents.
A goal of this low-altitude (350 km [217 mi]), non-sun-synchronous (precessing) satellite is to provide monthly precipitation data over 500 x 500 km grids, especially for the tropical-ocean regions. A network of ground stations to produce corroborating ground truth is under development. You can find more information and updates on this spacecraft and its products at this NASA Goddard Home Page: http://trmm.gsfc.nasa.gov
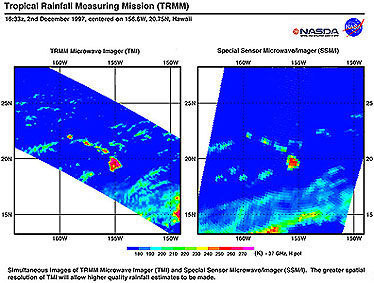
By December, 1997, the TRMM investigators released the first images to the Net. We reproduce three representative ones here, and you can access others via the above URL. The first compares images over the Hawaiian Islands, obtained simultaneously by TRMM's TMI sensor (left) and the SSM/I on the current DMSP satellite. The improved resolution of the TMI is evident. The islands were largely cloud-covered with localized rainfall (reds).
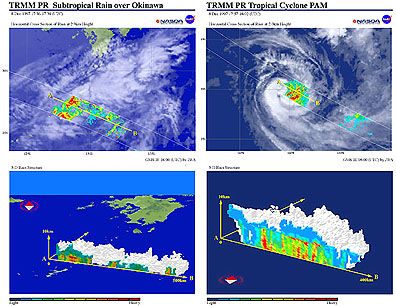
The second images show Typhoon Pam in the western Pacific, south of Okinawa in early December. The imaged cloud tops appear gray, and the colors in the flat projection represent relative rainfall intensities. The side view (cross-section) is an extrapolation of data to indicate rain distribution within the cloud mass.
The next image is a composite from several-days coverage showing worldwide rainfall during part of December. Major cloud masses are in white, areas of moderate or intermittent rainfall in purple, and heavier rains in reds, yellows, and greens. Can you locate a small hurricane in this image?
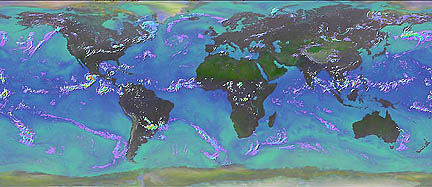
14-14: In several parts of the world, there are long, linear patterns of purple rainfall. Suggest a possible explanation. Can you locate a small hurricane in this image? ANSWER

Primary Author: Nicholas M. Short, Sr. email: nmshort@epix.net
Collaborators: Code 935 NASA GSFC, GST, USAF Academy
Contributor Information
Last Updated: September '99
Webmaster: Bill Dickinson Jr.
Site Curator: Nannette Fekete
Please direct any comments to rstweb@gst.com.