
We embark now to further explore what GIS does, how it works, what software systems are available, and what typical end products and applications look like. Before moving on, you may wish to gain a thumbnail insight into GIS through two tutorials now on the Internet. Geographers at the U.S. Geological Survey prepared the first site, http://info.er.usgs.gov/research/gis/title.html. The second http://www.esri.com/base/users/dtgis/front.html,, developed by ESRI, focuses on doing GIS analysis from desktop computers. ESRI also produced a glossary appropriate to GIS, accessed here (http://www.esri.com/base/users/glossary/glossary.html).). Two other sites worth visiting are the list of federal, state, and other organizations in the U.S. that have informative GIS sites (http://www.epa.gov/docs/oppe/spatial.html) ) and a good source of links to many worldwide sites prepared by ERIN, an environmental group tied to the Australian government (http://kaos.erin.gov.au/other_servers/category/Geographic_Information_Systems.html).
Perhaps the best way to appreciate the power of GIS, even before examining the design and function of the data handling system, is to introduce a typical case study ** and the thinking behind the steps in a site-suitability analysis. The following diagram summarizes the rationale behind such an analysis:
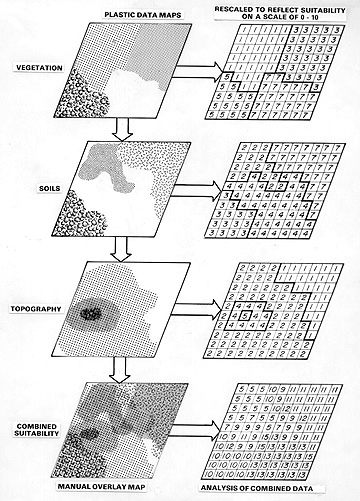
Suppose that three factors or variables, among the attributes that describe a geographic area under consideration, are essential in determining best sites for, say, a land development venture: Vegetation, Topography, and Soils . A data element on a map represents each variable. In this case the map shows the characteristics and distribution of the members or classes within the element theme, e.g., different types of soils and their properties.
We usually designate one map, often a cartographic map, as the base, over which we lay the others, (each then constitutes a data layer) either manually or digitally. Now, some soils, vegetation cover types, and elevations are more favorable than others in specifying their role in the site-selection process. Thus, for a certain intended use, we prefer high areas over low areas. So, we assign relative heights numerical ratings, say from 1 to 5. We can mark soils with optimum drainage by higher numbers in a scale of 1 to 8. We then subdivide a data element map into cells in a grid. We assign each cell a value based on its thematic rating. We can incorporate other kinds of data, e.g., tables representing some condition in the cells, provided there is some spatial connection. When we combine the maps sharing the same cells, each comprising a data layer, the values sum for each cell (ranging from lowest numbers = worst suited to highest = best suited). In a modern GIS, we do this digitally. The outcome is a map, in which we judge areas with the highest resultant scores the most favorably suited.
15-8: The numerical data and their values need to be assigned to each cell. This is called encoding. For the soils map, as an example, suggest 5 ways in which this encoding can be done. ANSWER
__________________________________________________________________________
** We present only two case studies in this Section. Other ones exist, by the thousands, but are not accessible to the writer. We invite you to submit your case example, which you should document and include with sufficient visuals, for a possible revision of this Section. Contact N.M. Short at nmshort@epix.net.

Primary Author: Nicholas M. Short, Sr. email: nmshort@epix.net
Collaborators: Code 935 NASA GSFC, GST, USAF Academy
Contributor Information
Last Updated: September '99
Webmaster: Bill Dickinson Jr.
Site Curator: Nannette Fekete
Please direct any comments to rstweb@gst.com.