Compare the band 1 image with that of band 7
Band 1
 Band 7
noting changes in gray levels at corresponding points. The other reflective bands (not included here) show similar variations.
2-6: What is/are the main differences between bands 1 and 7? ANSWER
But, band 6 is quite different from all others. Two contrasting tones (very light and dark) are partly the result of orientation of surfaces with respect to the sun's rays but are mainly controlled by the absorptive character of the rock units. The Navajo formation is moderately dark, as are the Emery and Mesaverde sandstones that reflect most of the sunlight and hence don't absorb enough to be warm. Darkest is the Wingate formation although its eastern dip slopes are less so; a darker band just to its right may be a combination of the Kayenta formation and shadows from Navajo hogbacks. A dark band near the Blue Gate Formation is a cliff shadow effect. Most shaly units are warmer (brighter) after having absorbed this radiation. Dark areas at the left of the image (beyond the map coverage) consist of wide outcrops of the Shinarump Formation. Similar thermal properties give the Upper and Lower Moenkopi the same medium tones.
The natural color composite (bands 1, 2, and 3), shown below, is a realistic rendition of this scene as it might appear from the air (the aerial photo shown earlier is too reddish because of a film response effect). The Wingate and Entrada formations are actually orangish in the field and the Lower Moenkopi and Carmel are maroon when seen on site. The units below Tarantula Mesa have a bluish undertone in the image, roughly a counterpart to bluish-gray and tan tones they possess in nature. In the image, it is hard to distinguish the bright area that corresponds to an extension of the Blue Gate formation into the valley from the alluvial fill as mapped; this implies that fill may have spilled onto the Blue Gate, covering it there. Note the dark orange-brown alluvium in the western valleys.
In the above false color composite (bands 2,3, and 4) most of the formation units have similar colors (although somewhat darker) to those in the natural composite. Because vegetation is sparse, it contributes little reflectance brightness in band 4, so that the rock and soil colors result from proportionately related DN levels in each composite. However, bright reds at the watering hole and along the canyon drainage are a certain indication that these intermittent creeks support active vegetation growth.
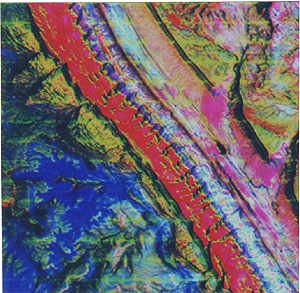
A PCA data set for the Waterpocket Fold was calculated using all seven TM bands from the summer 1984 Landsat overpass. In the VICAR-generated composite shown below, PC1 = red, PC2 = green, and PC4 = blue. The Navajo is uniquely discriminated by red (but note the isolated red patch [top center] of unknown nature). The Moenkopi divides into upper and lower areas, which are clearly visible. Wingate stands out as green, and Entrada as blue.
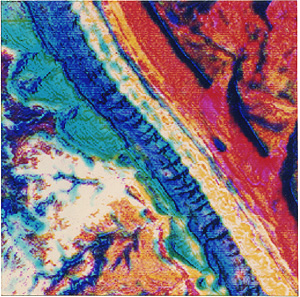
The same data were used to produce a color hybrid ratio. In the image below, we display the ratios of band 3 to band 2 in green and band 4 to band 5 in blue. We assigned thermal band 6 to red. Once again there are distinct separations. The Navajo is singled out as blue; the Wingate is blue-green; and the Entrada is a blotchy mustard yellow. Most of the units to the east are dominated by red colors, resulting from their ability as dark shales to absorb solar energy and re-radiate it. The light tan tones coinciding with the lower Moenkopi suggest bright contributions from the thermal band and the two ratios, blending these three primary colors into this whitish composite.
2-7: Of the PCA and Color Hybrid images, which seems to better separate units? ANSWER

Collaborators: Code 935 NASA GSFC, GST, USAF Academy
Contributor Information
Last Updated: September '99
Webmaster: Bill Dickinson Jr.
Site Curator: Nannette Fekete
Please direct any comments to rstweb@gst.com.