
Maximum Likelihood Classification of the Fold
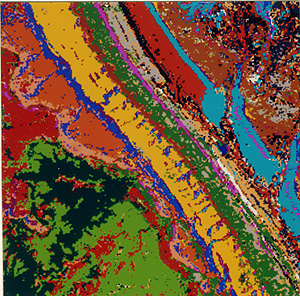
This Waterpocket Fold scene was part of a 1984 study of how accurately we can identify rock units using Landsat TM data from arid (vegetation-poor) terrains. First we present a maximum likelihood supervised classification of the scene from the summer of 1981, without band 6, made on the IDRISI processing system.
Its accuracy is an estimated 70%; that is, the rock units or formations are correctly identified over at least that percentage of surface exposures (chief sources of error: soil cover and similar lithologies). This is high in view of shadow and slope effects, soil cover, and other variables. Among variable misidentifications and conflicts: The Navajo palette color also occurs in the prospect pits and along canyon walls on Tarantula Mesa; black areas assigned to the localized Carmel/Entrada (combined because of a 15 class limitation) are scattered throughout the scene; Kayenta almost disappears in the south except where it shows up incorrectly west of the Chinle (which itself is not well mapped); colors assigned individually to the Morrison/Mancos and, the Masuk and the Emery Formations are dispersed within each other. Note too that the Upper Moenkopi and Shinarump Formation were combined because the latter is too thin in outcrop area to be mapped discretely at this resolution.
2-8: What other explanation(s) for the black pattern distribution can you think of; account for the apparent misclassifications associated with the Navajo being elsewhere besides its outcrop ridge on the fold; the Morrison-Mancos unit grades into alluvium in the valley; why? ANSWER
There can be considerable subjectivity in setting up and interpreting any classification. Two more classifications of the Waterpocket Fold are shown below to demonstrate how changing factors lead to modified results. Both were made on the IDIMS system at the Goddard Space Flight Center.
The upper classification shows the same summer of 1984 scene but applies a different set of training sites and, unlike the one above, includes thermal band 6. The formations are exceptionally distinct. Red was assigned to alluvium, which, for the most part, was placed correctly (the large section of red occupying the Blue Gate shale member [in blue] of the Mancos formation corresponds to strongly weathered slope wash along steep slopes against Tarantula Mesa). The Dakota formation is a wine purple color (but the white strip near it is of unknown character). The Kayenta is singled out in reddish-brown, and the Chinle is pinkish-peach.
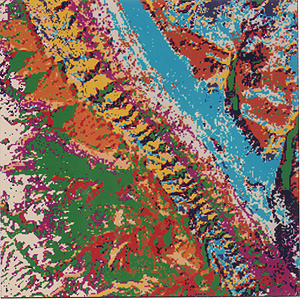
The illustration above is a classification of a Landsat scene acquired during the winter of 1985. Results are less positive, although many of the units are where they should be. The various formations within the monoclinal limb are discernible but with more irregular outcrop patterns and they include more patches of other units. Note the black patches which are shadows in erosional alcoves. The Moenkopi is not subdivided into upper and lower areas in this winter version. The light grayish-tan patches along the left side of the image mark snow cover.
2-9: Compare the summer IDRISI to the summer IDIMS classifications; why does the second (lower) IDIMS classification seem less accurate than the one above it; account for the black patterns in this second version. ANSWER
On the whole, the Waterpocket Fold has proved an exceptional test site. Its field characteristics are especially suited to enhancements like PCA and ratioing. The abundant exposures of rocks rather than soil and vegetation cover make discriminating them easier and hence improve the classification accuracy's over most geological units, particularly those in areas where the units are hidden by weathering products and organic growth. As we have always known for aerial photographs, space imagery has limited value for direct mapping in vegetated terrains, so that field observations requiring on-site inspection and even digging remain the traditional way to map rock units.
2-10: Why aren't rock units (formations) as easy to map in the eastern U.S. as in parts of the West; what might cause mapping problems in desert areas such as in Utah? ANSWER

Collaborators: Code 935 NASA GSFC, GST, USAF Academy
Contributor Information
Last Updated: September '99
Webmaster: Bill Dickinson Jr.
Site Curator: Nannette Fekete
Please direct any comments to rstweb@gst.com.