
VEGETATION APPLICATIONS:
AGRICULTURE, FORESTRY, AND ECOLOGY
General Principles For Recognizing Vegetation
Because many remote sensing devices operate in the green, red, and near infrared regions of the electromagnetic spectrum, they can discriminate radiation absorption and reflectance of vegetation. Absorption centered at about 0.65 µm (visible red) by chlorophyll pigment in green-leaf chloroplasts, and to a similar extent in the blue, removes these colors from white light, leaving the predominant reflectance for visible wavelengths concentrated in the green. Thus, most vegetation has a green-leafy color. There is also strong reflectance between 0.7 and 1.0 µm (near IR)in the leaf mesophyll cells, within which light may delay before emerging as reflection. The intensity of this reflectance is commonly greater (higher percentage) than from most inorganic materials, so vegetation appears bright in the near-IR wavelengths . These properties of vegetation account for their tonal signatures on multispectral images: darker tones in the blue and, especially red, bands, somewhat lighter in the green band, and notably light in the near-IR bands (maximum in Landsat's Multispectral Scanner bands 6 and 7 and Thematic Mapper band 4).
These spectral variations facilitate fairly precise detecting, identifying and monitoring of vegetation on land surfaces and, in some instances, within the oceans and other water bodies. Thus, we can continually assess changes in forests, grasslands and range, shrublands, crops and orchards, and marine plankton, often at quantitative levels. Because vegetation is the dominant component in most ecosystems, we can use remote sensing systems in space to routinely gather valuable information for characterizing and managing of these systems.
3-1: Drawing on your experience and common sense, make (or think) a list of the factors that will affect the spectral signatures of field crops. ANSWER
One of the most successful applications of multispectral space imagery is monitoring the state of the world's agricultural production. This application includes identifying and differentiating most of the major crop types: wheat, barley, millet, oats, corn, soybeans, rice, and others. Thus we can quantify on a global scale the total acreage dedicated to these and other crops at any time. Of greater import, is accurately (best case 90%) estimating the expected yields (production in bushels or other units) of each crop, locally, regionally or globally. We do this by first computing the areas dedicated to each crop, and then incorporating reliable yield assessments per unit area, which agronomists gather at representative ground-truth sites. We enhance reliability by using the repeat coverage of the croplands afforded by the cyclical satellites orbits assuming, of course, cloud cover is sparse enough to foster several good looks during the growing season. Usually, the yield estimates obtained from satellite data are more comprehensive and earlier (often by weeks) than determined conventionally as harvesting approaches. Information about soil moisture content, often critical to good production, can be qualitatively (and under favorable conditions, quantitatively) appraised with certain satellite observations. Under suitable circumstances, we can detect crop stress generally from moisture deficiency or disease, and sometimes suggest treatment before the farmers become aware of problems. Some remote sensing experts claim that they can use satellite to detect drug-supplying crops, such as poppies and wild tobacco (marijuana).
Identifying crops from remote-sensing images depends on several plant characteristics. For instance, in general, deciduous leaves tend to be more reflective than evergreen needles. Thus, in infrared color composites, the red colors associated with those bands in the 0.7 - 1.1 µm interval are normally richer in hue and brighter from tree leaves than from pine needles. So, for crops, the important parameters we use are the size and shape of the crop type ( e.g. soybeans have spread out leaf clumps and corn has tall stalks, thin, tassled stems, and small leaves like wheat), the shape and surface area of individual leaves, the plant height and amount of shadow it casts, and the spacing or other planting geometries of row crops (the normal arrangement of legumes, feed crops, and fruit orchards). The stage of growth (degree of crop maturity) is also a factor. For example during its development wheat, passes through several distinct steps such as, developing its kernel-bearing head, and changing from shades of green to golden-brown.
3-2: How would non-growing or dead vegetation (such as crops in senescence) be detected by Landsat? ANSWER
We show these stages for wheat in this sequential illustration:
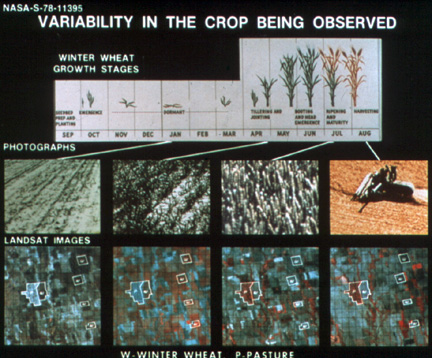
Note that, in the Landsat imagery, the wheat fields (particularly the light-blue polygon in the far-left image) show their brightest response in the IR (hence red) during the emergent stage but become less responsive by the ripening stage. The grasses and alfalfa that make up pasture crops mature (redden) much later.
3-3: This picture was made as part of the LACIE program, designed to demonstrate that crop history can be monitored by satellite and that productivity (yield in bushels) and prediction of total yield in a season from regions of major productions can be quantitatively assessed. How where the specific crop types used as training sites identified (determined)? ANSWER
An additional image variable is, the crop's background, namely the nurturing soil, which may change color and other properties, and the amount of moisture it holds. All of these factors combine to cause small to large differences in spectral signatures for the varieties of crops cultivated by man. Generally, we must determine the signature for each crop in a region from representative samples at specific times. However, some crop types have universally similar spectral responses at equivalent growth stages.

Collaborators: Code 935 NASA GSFC, GST, USAF Academy
Contributor Information
Last Updated: September '99
Webmaster: Bill Dickinson Jr.
Site Curator: Nannette Fekete
Please direct any comments to rstweb@gst.com.