 |
|---|
| Plate P-10 |
|
|---|
| Plate P-10 |
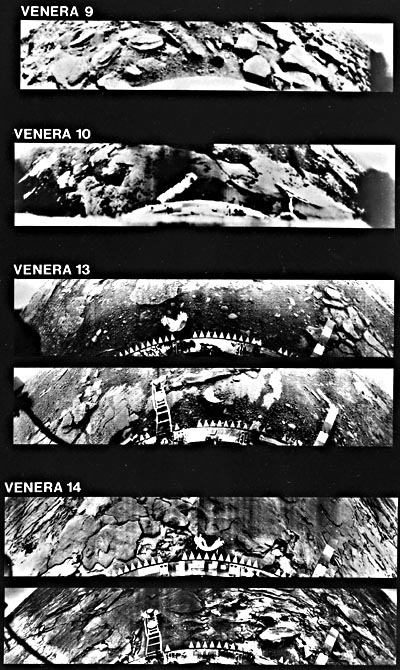
The surface of Venus is impossible to observe optically because of its thick global cloud deck, but television panoramas of the terrain have now been obtained by the Soviet Venera 9, 10, 13, and 14 landers, which show small-scale geomorphology (Florensky et al., 1977; Florensky et al., 1983; Garvin et al., 1984). Large-scale landforms and global physiography have been surveyed with radar both by terrestrial radio telescopes and by orbiting spacecraft, which have revealed mountain ranges, volcanoes, plateaus, and mare-like terrains. Most recently, radar imagery with 1- to 2-km resolution has been acquired by Soviet Venera 15 and 16 spacecraft for about one quarter of the Venusian surface, above latitude 30°N. This imagery shows an amazing variety of landforms, ranging from huge concentric features (coronas) to strongly banded ridge and valley topography ("parquet" terrain). From 1978 to 1981, the American Pioneer Venus (PV) orbiter mapped 93 percent of the global topography at 30- to 110-km resolution, finding huge mountains (Figures P-10.1 and P-10.2) in the northern hemisphere 11 km above the dominant rolling plains. Collectively, these various investigations show Venus to be a tectonically and volcanically active world, presumably due in part to its large mass (90 percent that of the Earth).
| Figure P-10.1 | Map |
|---|---|
 |  |
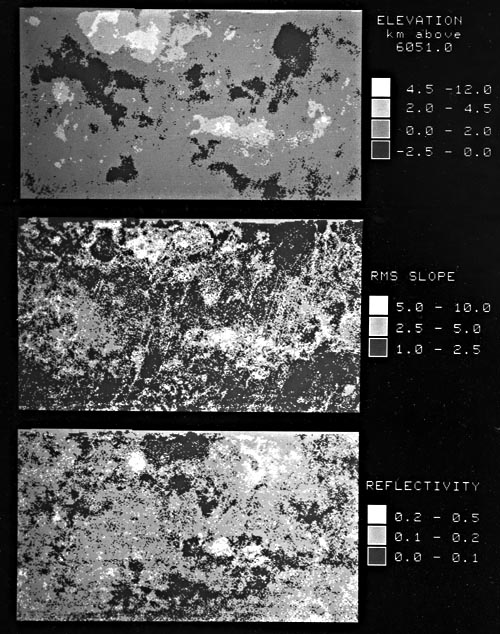
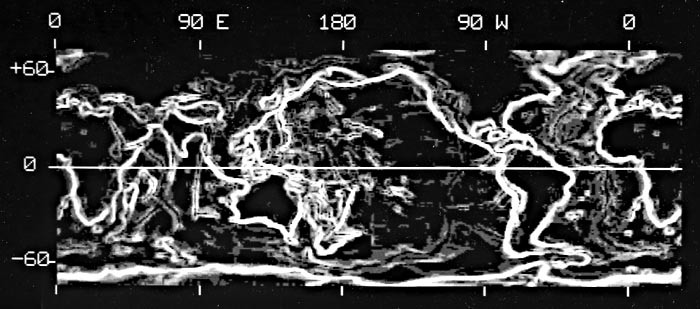
The PV radar altimeter produced data on the topography, surface roughness (in RMS slopes from 1 to 10°), and reflectivity, shown on Mercator projections in Plate P-10 with 100-km resolution. The magnitude of the topographic slope on a horizontal baseline of about 100 km has been computed and compared with that of the Earth (Figure P-10.3). The surface of Venus has been classified into four topographic provinces. The lowlands, including the narrow cleft-like chasmata such as Artemis and Devana, make up about 25 percent of the surface area. Rolling plains, with elevations from 0 to 2 km relative to a 6051.0-km planetary radius, are globally dominant, comprising about 65 percent of the surface. The continent-like highlands, with elevations from 2 to 4.5 km, are about 7 percent of the surface and the mountainous regions are about 1 percent. The mountains include peaks 11 km high (Maxwell), contrasting with the highest terrestrial mountains, the Himalayas, which are only 8 km above sea level (although Hawaii is 13 km above the ocean floor).
| Figure P-10.2 | Figure P-10.3 |
|---|---|
 |  |
 | |
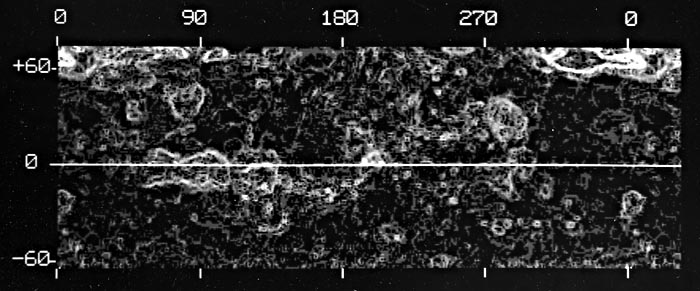
Topographic slope distributions for Venus and Earth are shown in Figures P-10.2 and P-10.3 with cylindrical projections. The slopes are calculated from the planar topography gradient over 3 by 3° regions from 100-km resolution data. It is apparent that high terrestrial slopes are typical of continental margins and of features related to plate convergence or divergence. The only slopes on Venus approaching those of continental margins are the ones bordering Ishtar Terra. Highland margins have lower slopes. Flat areas, with 0° slopes, distinguish terrestrial platforms and cratons from Venusian highlands; detailed comparisons are given by Sharpton and Head (1985).
The radar-derived surface roughness (middle map, Plate P-10) represents the spatial distribution of facets (scatterers) at scales from about 20 cm to 20 m, and relates to the features observable in surface images from Venera landers (Figure P-10.4). The roughness, expressed as RMS slope, has been subdivided into smooth, moderate, and rough categories (increasing slopes). Most of Venus is smooth to moderately rough at meter scales, contrasting with the rougher surfaces of the Moon and Mars. There is an obvious correlation between meter-scale roughness and elevation, as might be expected, with roughness increasing systematically with elevation except for the Lakshmi plateau. This may be related to weathering rates or efficiency or to surface age. Higher features may be younger and thus fresher, with steep slopes preserved. Alternatively, if erosion processes on Venus increase surface roughness, higher regions would be older.
| Figure P-10.4 |
|---|
 |
The reflectivity (bottom map, Plate P-10) has been measured from the radar ethos. Reflectivity is strongly related to surface porosity and composition, the abundance of free metals (as in iron meteorites), graphite, and oxides and sulfides of Fe, Ti, Mn, Sn, Pb, and Cu being especially important. Minerals such as pyrite, hematite, ilmenite, and magnetite would therefore affect reflectivity very strongly. This range in reflectivity y from 0.0 to 0.5 corresponds to materials ranging from poor conductors (e.g., very porous material) to excellent conductors with high dielectric constants. Reflectivity values less than 0.1 generally represent soils or weakly cemented materials such as the lunar regolith and eolian sands. Rocks generally fall in the 0.1 to 0.2 range, with a few dense or metal-rich rocks having values of 0.2 to 0.3 (high dielectric constants). Materials above 0.3 are extremely rich in free metals or other highly conductive materials. As shown on the map, there are extensive areas of high reflectivity, mostly mountainous, although a large area of high reflectivity is adjacent to the lowland Atalanta Planitia. In general, Venus appears to lack a globally continuous porous regolith like that of the Moon. The areas of high reflectivity may be volcanics with unusually high Fe or Ti contents, like some lunar basalts, or alteration products such as pyrite, hematite, or pyrolusite. Concentrations of free carbon, such as graphite, could also play a role. Such highly reflective surfaces have not been observed on the Moon or Mars thus far, and their nature is not understood. More knowledge about their relation to geologic structures is needed. NASA/Pioneer Venus; MIT and Brown University.
Continue to Plate P-11| Chapter 10 Table of Contents.| Return to Home Page| Complete Table of Contents|