 |
 |
|---|---|
| Plate G-10 | Map |
|
|
|---|---|
| Plate G-10 | Map |
A surging glacier is defined as "a glacier that alternates periodically between brief periods (usually one to four years) of very rapid flow, called surges, and longer periods (usually 10 to 100 years) of near stagnation. During a surge, a large volume of ice from an ice-reservoir area is displaced downstream at speeds up to several meters per hour into an ice-receiving area, and the affected portion of the glacier is chaotically crevassed. Only in exceptional cases does the glacier advance beyond its former limit (of surge). In the interval between surges, the ice reservoir is slowly replenished by accumulation and normal ice flow, and the ice in the receiving area is greatly reduced by ablation" (Bates and Jackson, 1980).
A surging glacier is one in which the movement of the ice suddenly increases to several times its normal rate of flow, resulting in an abrupt advance of the terminus amounting to several kilometers or more over a period of a few months (Meier and Post, 1969). During the interval between surges, the lower part of the glacier is in a stagnant state. The surge occurs in the active part of the glacier, and the terminus advances over this zone of inactive ice or "deglaciated" terrain to reach about as far forward as the previous surge. Such precipitous advances may engulf parts of highways, railroads, or other manmade structures and dam adjacent valleys, producing ice-dammed lakes, as in the case of the Moreno Glacier, a surging outlet glacier of the northern Patagonian ice field (see Plate G-4 and Figure G-4.2). The failure of ice-dammed lakes can also cause serious flooding downstream (Williams, 1983d).
| Figure G-10.1 | Figure G-10.2 |
|---|---|
 |
 |
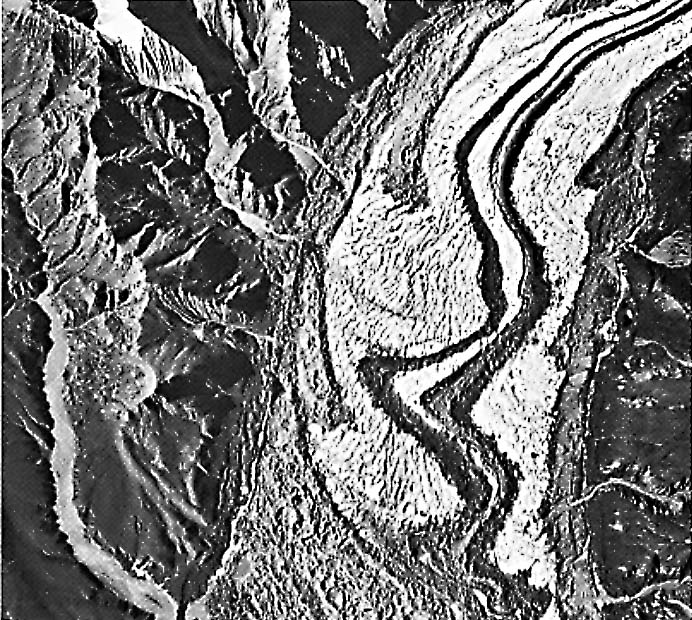
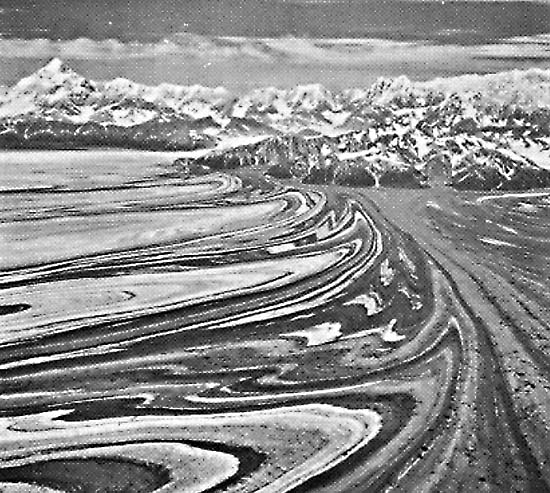
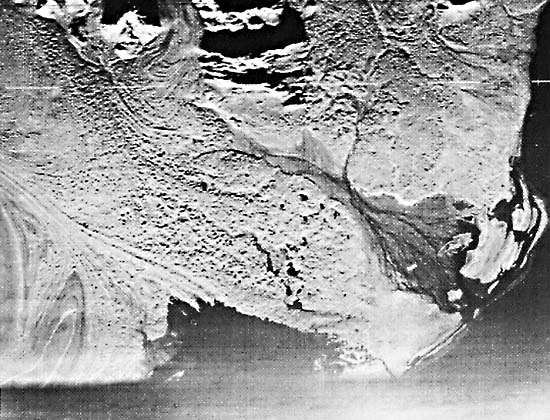
Surging glaciers can generally be identified on Landsat MSS images by the looped or crenulated character of medial moraines in the lower parts of such glaciers (Figure G-10.1). The eastern part of the Malaspina Glacier (see Plate G-7 and Figures G-7.1, G-7.2, and G-7.3) and the Tokositna, Lacuna, and Yentna Glaciers of the Mount McKinley massif, Alaska Range (see Plate G-9) are good examples of such contorted moraines. Krimmel et al. (1976) used a Landsat image to identify surging and nonsurging glaciers in the Pamir Mountains of the Soviet Union. Post et al. (1976) used Landsat images to measure the motion of the Lowell and Tweedsmuir surging glaciers in the St. Elias Mountains of British Columbia, Canada; Williams (1983f) used successive Landsat images of the surging glacier, Eyjabakkajökull, Iceland, to measure cumulative advances of 1.0 and 2.8 km. Meier (1976) evaluated a Landsat image of the Mount McKinley massif and described three surging valley glaciers (Plate G-9).
A review paper of the distribution of surging glaciers in western North America was prepared by Post (1969). Thorarinsson has discussed those glaciers in Iceland that are known to have surged historically (1964, 1969).
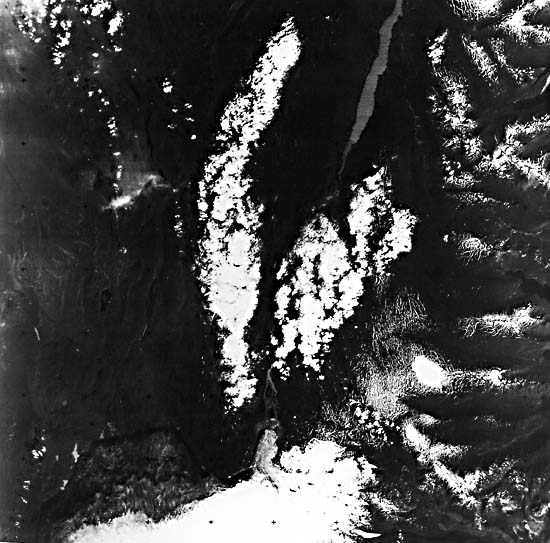
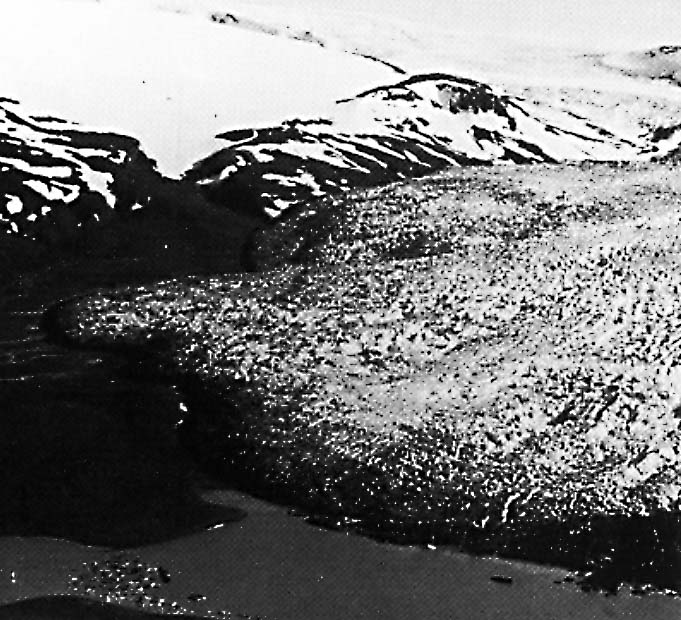
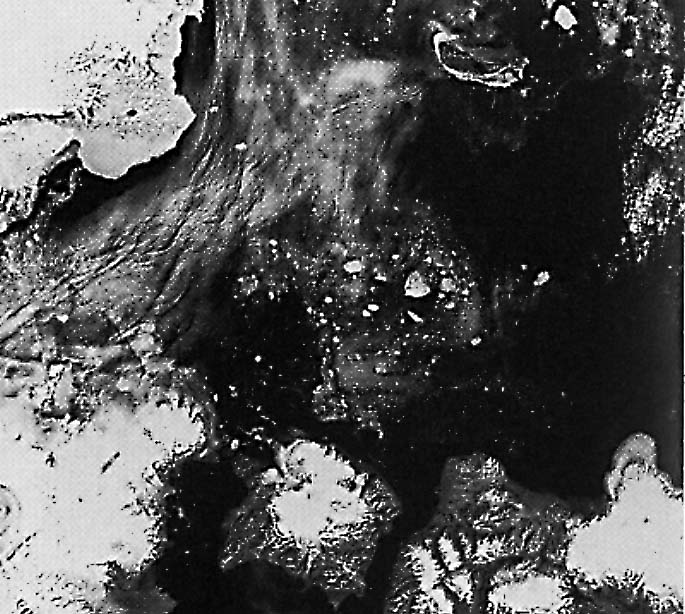
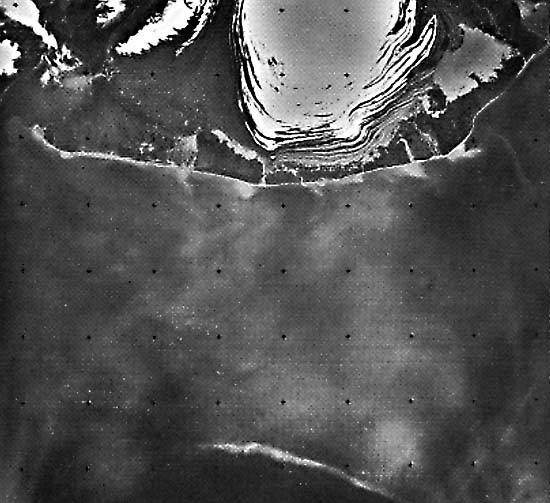
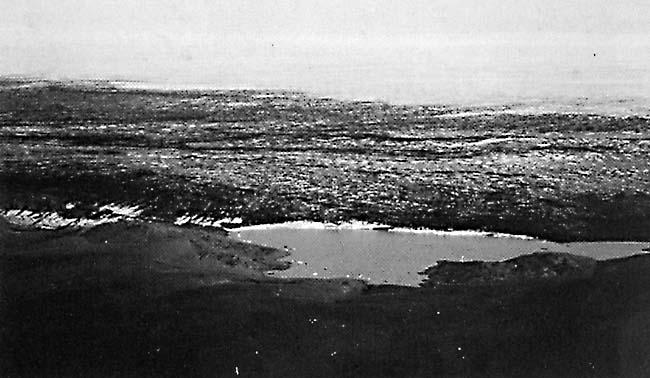
Glacier advance has been noted on a number of sequential Landsat images of Iceland during 1972-1982 (Williams, 1983 f). This Plate is a Landsat-3 RBV image of Eyjabakkajökull and Brúarjökull, two of the seven surging outlet glaciers of the Vatnajökull ice cap, Iceland (see Plate G-6). Brúarjökull is in a stagnant phase from its last surge of 8.0 km in 1963-1964 (Thorarinsson, 1969); Eyjabakkajökull is also in a stagnant phase from its 2.8-km surge in 1972-1973. Bare glacial ice of the ablation zone is visible on both glaciers. Figures 9-8 and G-10.2 are oblique aerial photographs of Brúarjökull and Eyjabakkajökull, respectively. Two small ice caps, Thrándarjökull (22 km2) and Hofsjökull (í Lóni), are located to the east of Eyjabakkajökull. A delta is building out into lake Lagarfljót from glacial sediment derived from Eyjabakkajökull. Part of the fjord, Berufjördur, is visible east of Thrándarjökull. Three other Icelandic ice caps, Drangajökull, Langjökull, and Hofsjökull have outlet glaciers that are known to surge (Clapperton, 1975).
| Figure G-10.3 | Figure G-10.4 |
|---|---|
 |
 |
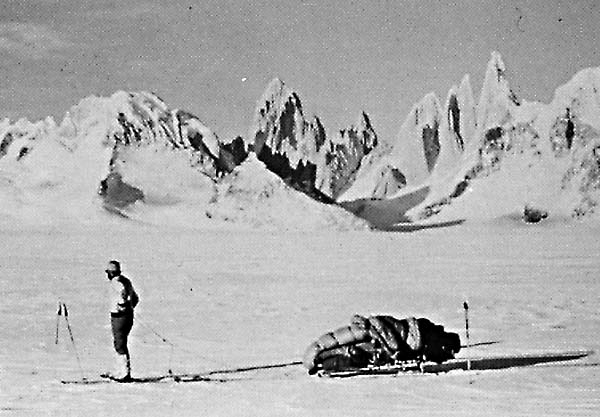
According to Thorarinsson (1969), the first recorded surge of Eyjabakkajökull occurred in 1890, when its terminus suddenly moved forward approximately 0.6 km. During 1972-1973, 82 years later, Eyjabakkajökull surged forward about 2.8 km. It began to surge in late August 1972, and the terminus had already advanced about 1 km by the time the first Landsat image of the area was acquired on October 14, 1972 (1083-12023) (Williams et al., 1974). A September 22, 1973, image (1426-12070; see Plate G-6) showed an additional advance of 1.8 km. Plate G-10 has nearly three times better spatial resolution than the MSS image (Plate G-6) and shows considerably more morphological detail (Williams, 1979; Williams and Ferrigno, 1981). Figure G-10.2 is an oblique aerial photograph looking south across the chaotically crevassed terminus of Eyjabakkajökull as it appeared on July 25, 1973, after it had completed its 2.8-km advance.
Figure G-10.1 is a vertical aerial photograph showing the characteristic contorted medial moraines near the terminus of the surging Klutlan Glacier, Yukon Territory, Canada. Figure G-10.3 is a Landsat image of surging, tidal, and outlet glaciers on four of the several islands of the Svalbard archipelago, Norway. Svalbard has many surging glaciers; Liestøl (in press) notes that 69 of Svalbard´s glaciers have surged during the past century. Negribreen, on Spitsbergen, and Bråsvellbreen, on Nordaustlandet, are two surging glaciers that are visible on this image.
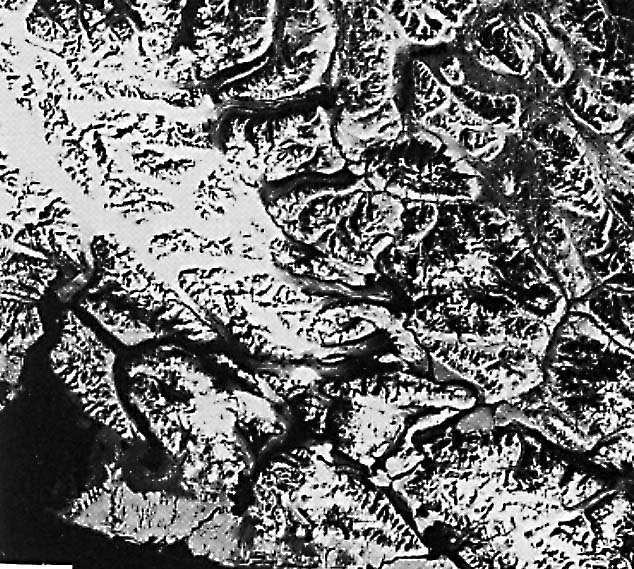
Figure G-10.4 is a Landsat image of the Lowell and Tweedsmuir surging glaciers on the western side of the St. Elias Mountains. Also visible is the Hubbard Glacier, a tidal glacier in a fjord in the left center margin of the image. Tidal glaciers are discussed in Plate G-11. Landsat 30157-11565-D, August 9, 1978.
Continue to Plate G-11| Chapter 9 Table of Contents.| Return to Home Page| Complete Table of Contents|